Recently, Dr. Wang Yusheng from the VaST research team at Wuhan University shared their work on using Livox lidars to generate maps in rail transit scenarios and optimizing the colors of point cloud maps based on high-precision measurement of reflectivity, to assist in the construction of rail transit semantic maps.
Measured Scenarios and Point Cloud Maps
The project team planned to build a map of large railway environments through self-developed SLAM algorithms combined with the automatic extraction of power transmission towers, railway tracks, and railway signals, to generate semantic maps of railway environments. In actual scenarios, certain features may be missed or incorrectly extracted in the automatic extraction process (such as the wrong identification of a railway signal as a power transmission pole). As a result, users would need to manually inspect the reconstructed point cloud map, which is cumbersome and time-consuming. Moreover, considering railway tracks are usually long and generate high volumes of point cloud data, good point cloud visualization is essential for efficient and accurate manual inspection.
The project team chose a freight maintenance area as the site for semantic map construction and manual inspection to test their method on point cloud map modification. The scene was reconstructed with multiple Livox lidars using self-developed Rail-SLAM algorithms, which also generated a semantic map automatically.
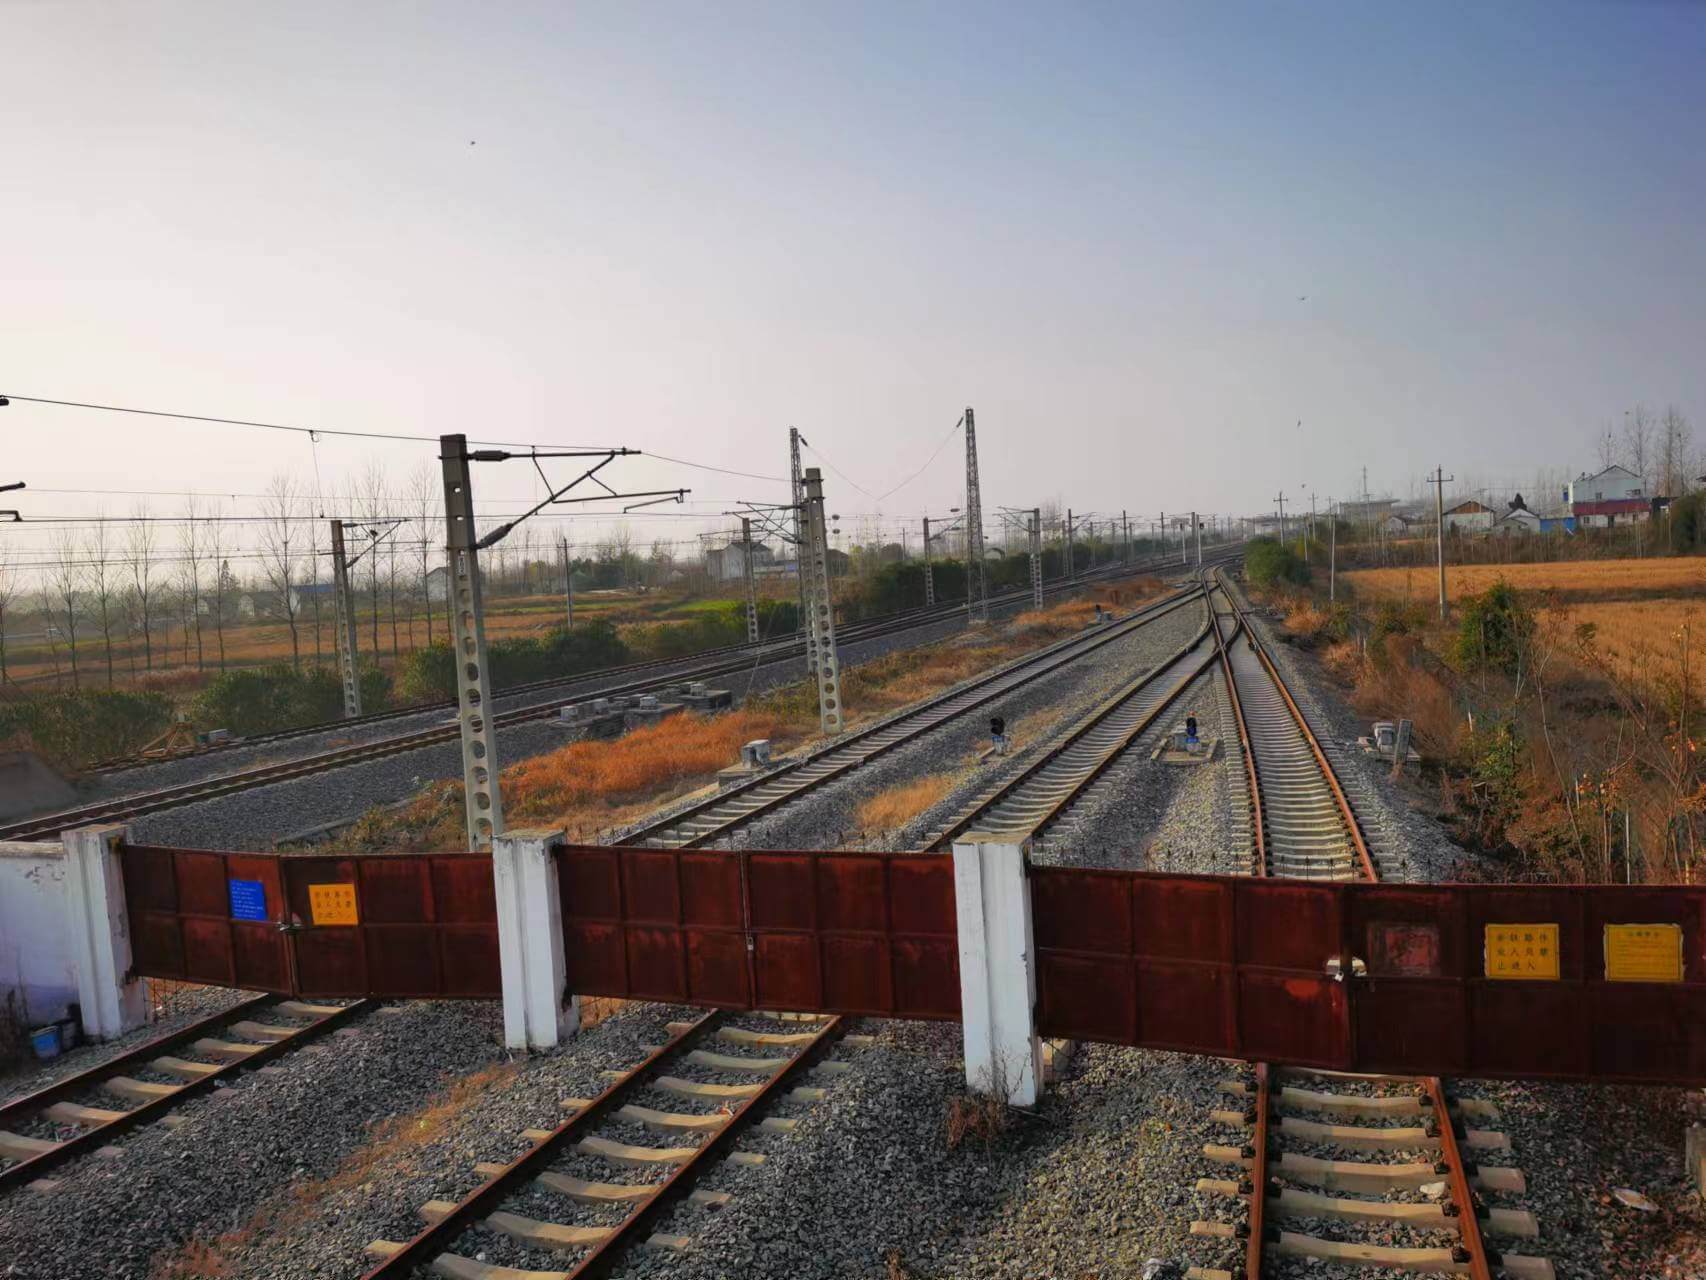
Image 1 The measured freight railway maintenance station
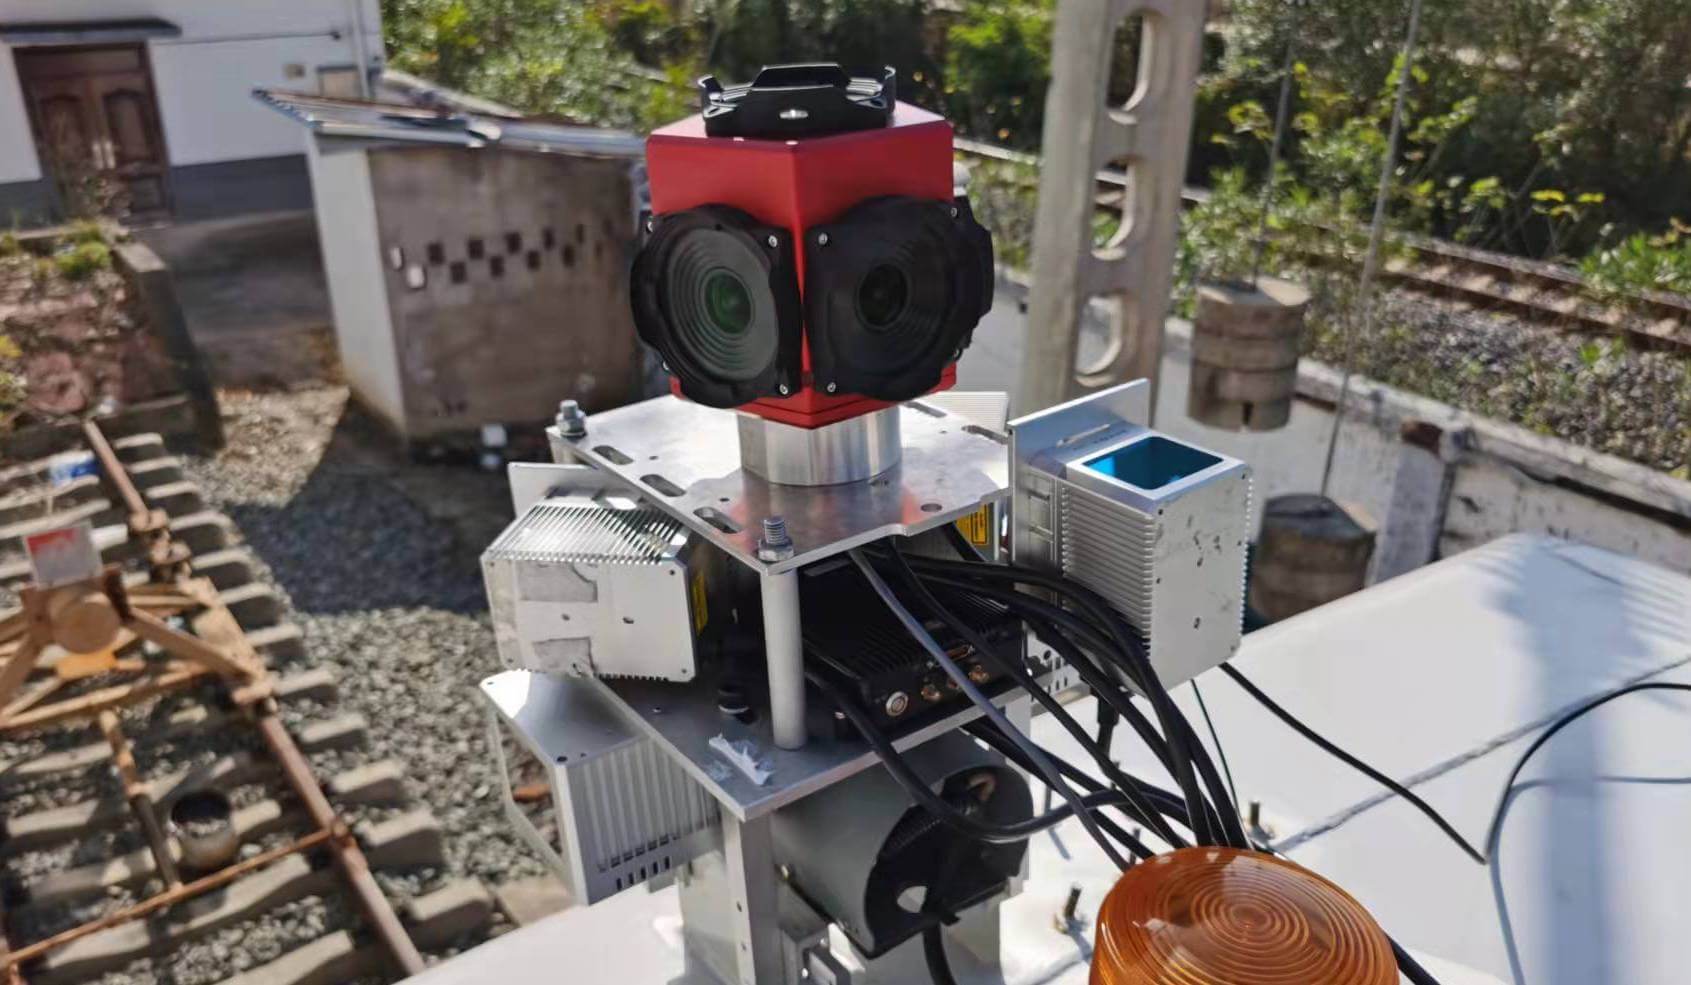
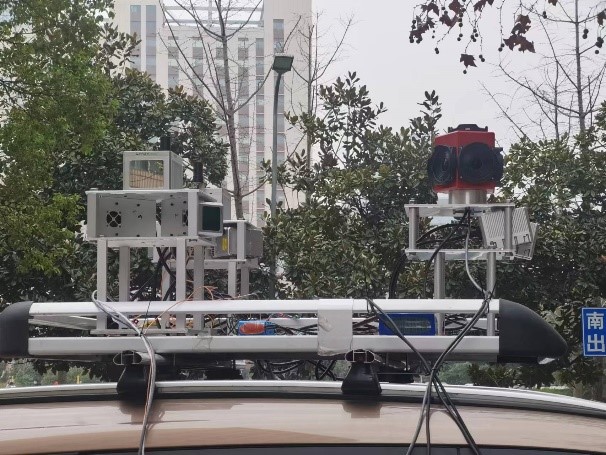
Image 2 The seven-LiDAR setup on the maintenance rail vehicle developed by the project team (5 Livox Horizon and 2 Livox Tele-15)
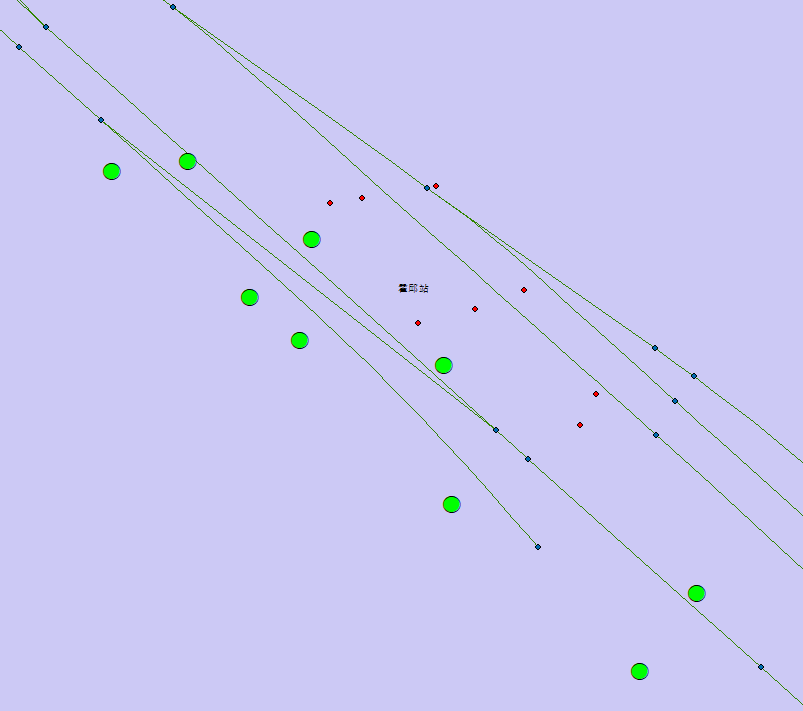
Image 3 A semantic map generated by self-developed algorithms - the green lines are the center lines of the railway tracks, the large green points are the power transmission towers, and the small points are the trackside signals.
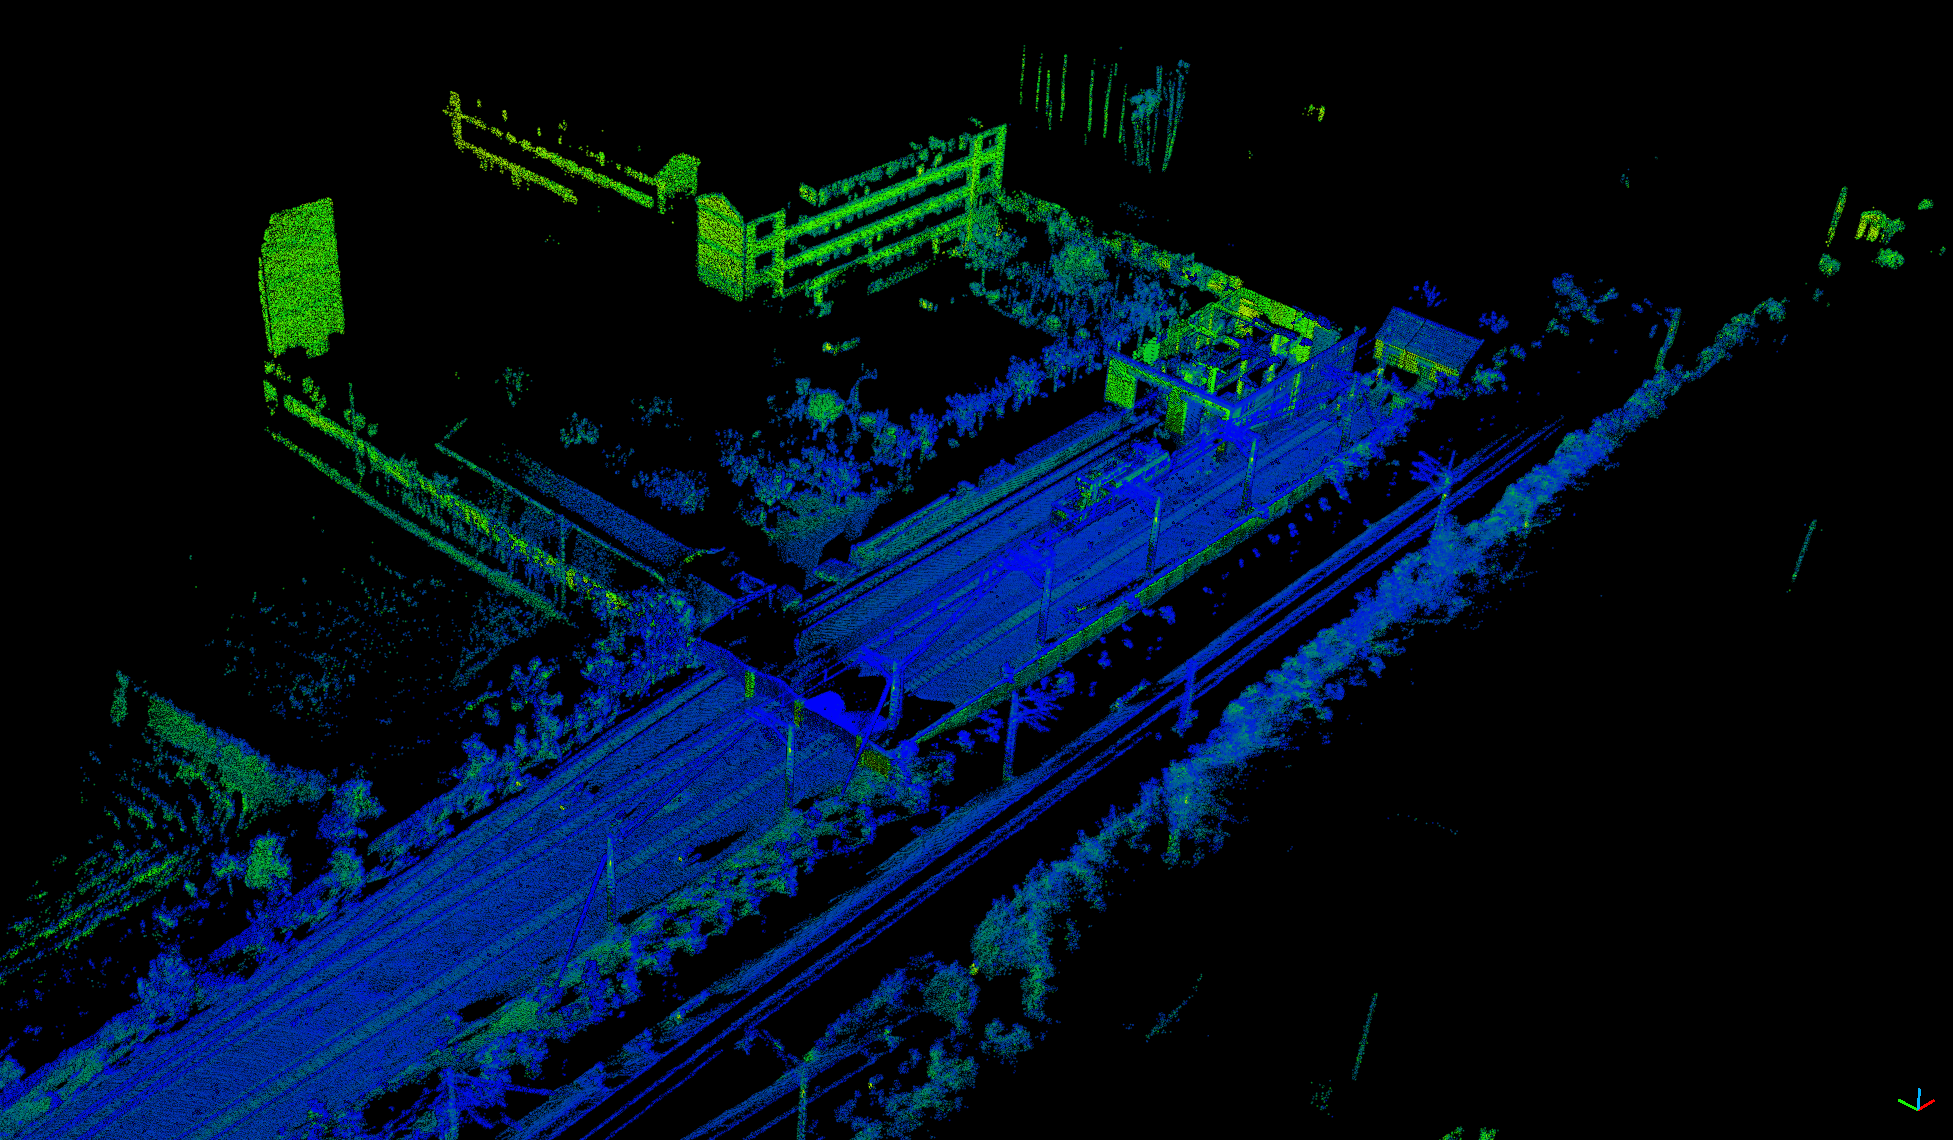
Image 4.1 Output from Livox Viewer in default resolution
The result showed that the tracks, sleepers, and other objects are clearly distinguishable due to data output based on their default reflectivity, thanks to the high-precision resolution of Livox lidars.
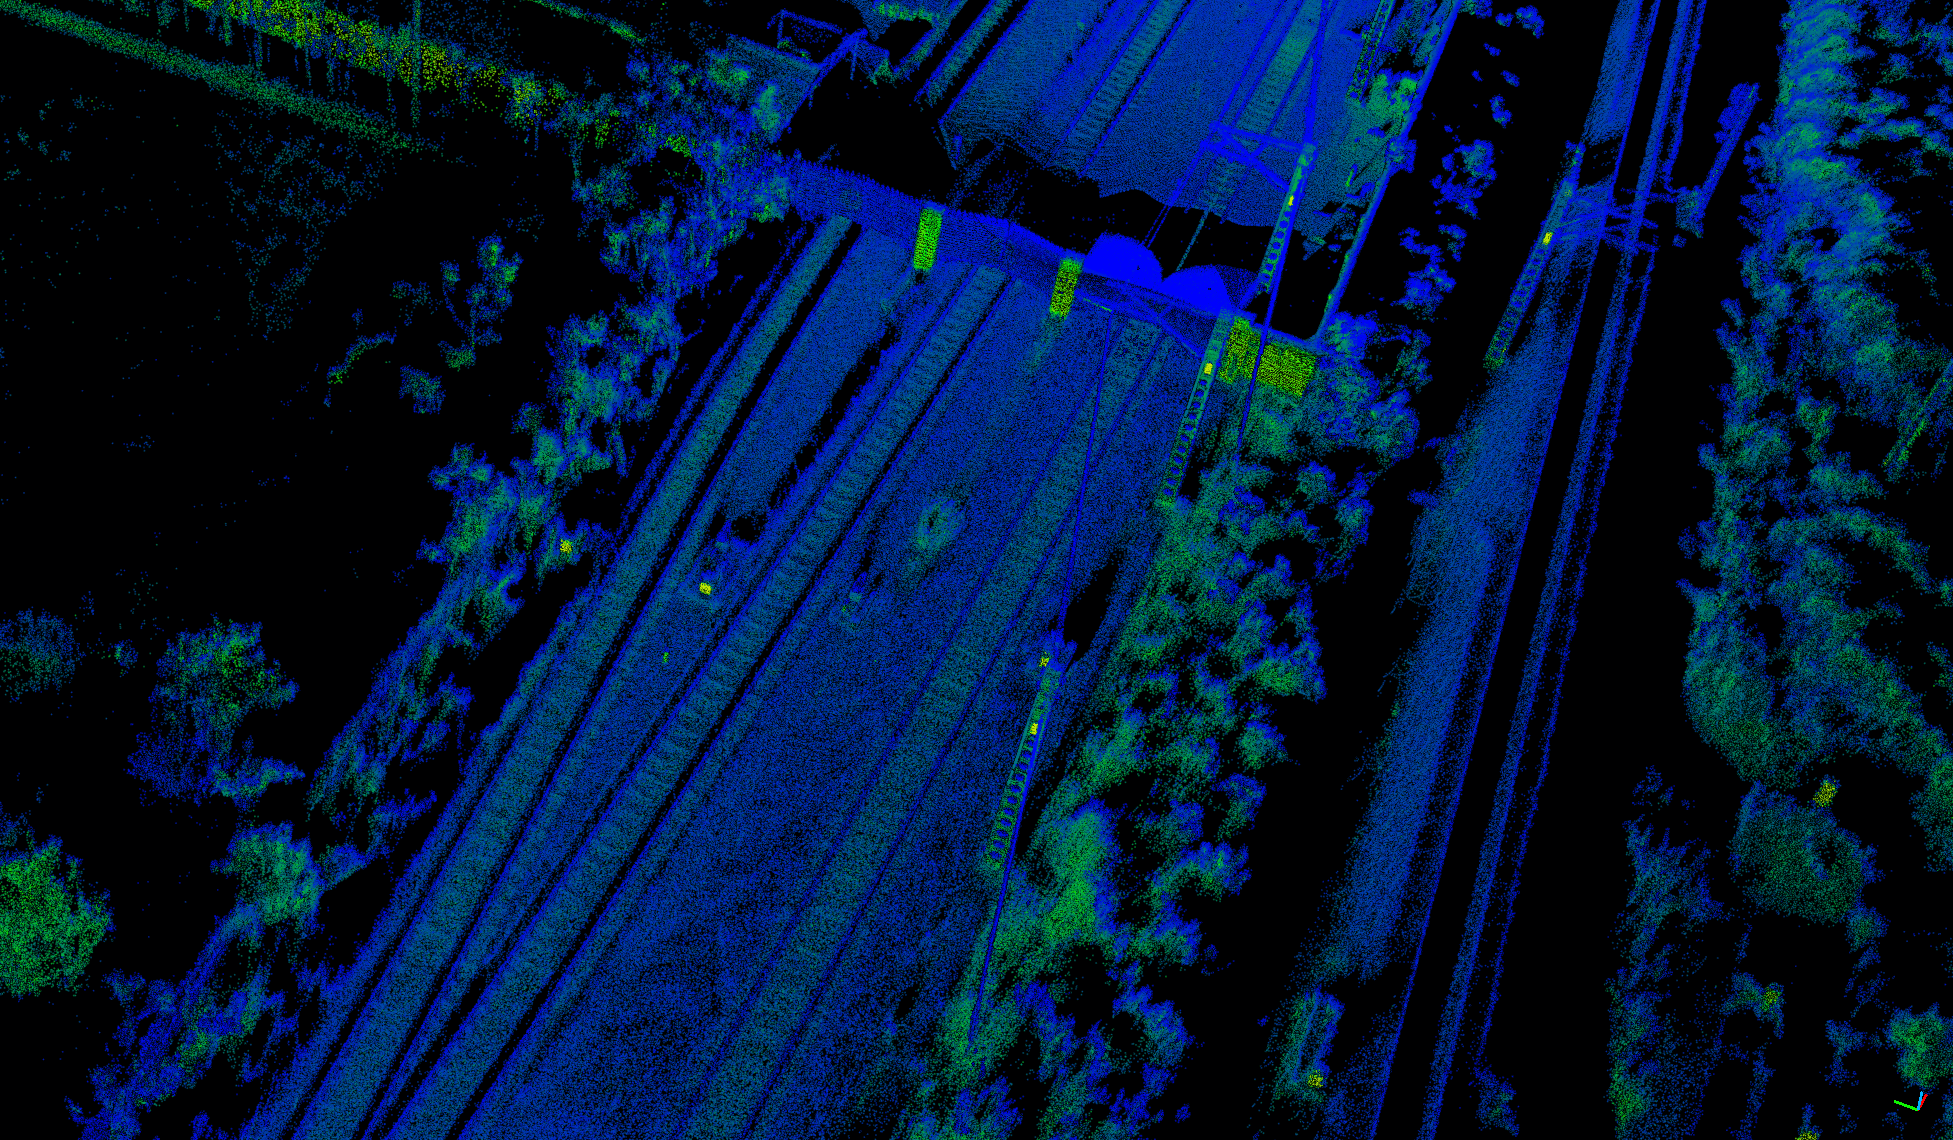
Image 4.2 Detailed image (Bottom left of Image 4.1)
As seen in Image 4.2, cement materials such as buildings and transmission towers appear in green; steel objects such as railway tracks and power lines appear in blue.
Video 1 Rail-SLAM mapping of a railway track
To avoid false positives in the detection of similar material objects due to non-obvious color changes and similar reflectivity, the project team further optimized the point cloud maps using an editing software.
Optimization method
Required software: CloudCompare (on Windows or Ubuntu)
First, import the constructed map into CloudCompare; then select “Display by Reflection Intensity” and display the map in “High Contrast”. You may choose to use the shader depending on the display quality; or adjust the point size according to point cloud density. Lastly, save the optimized point cloud map.
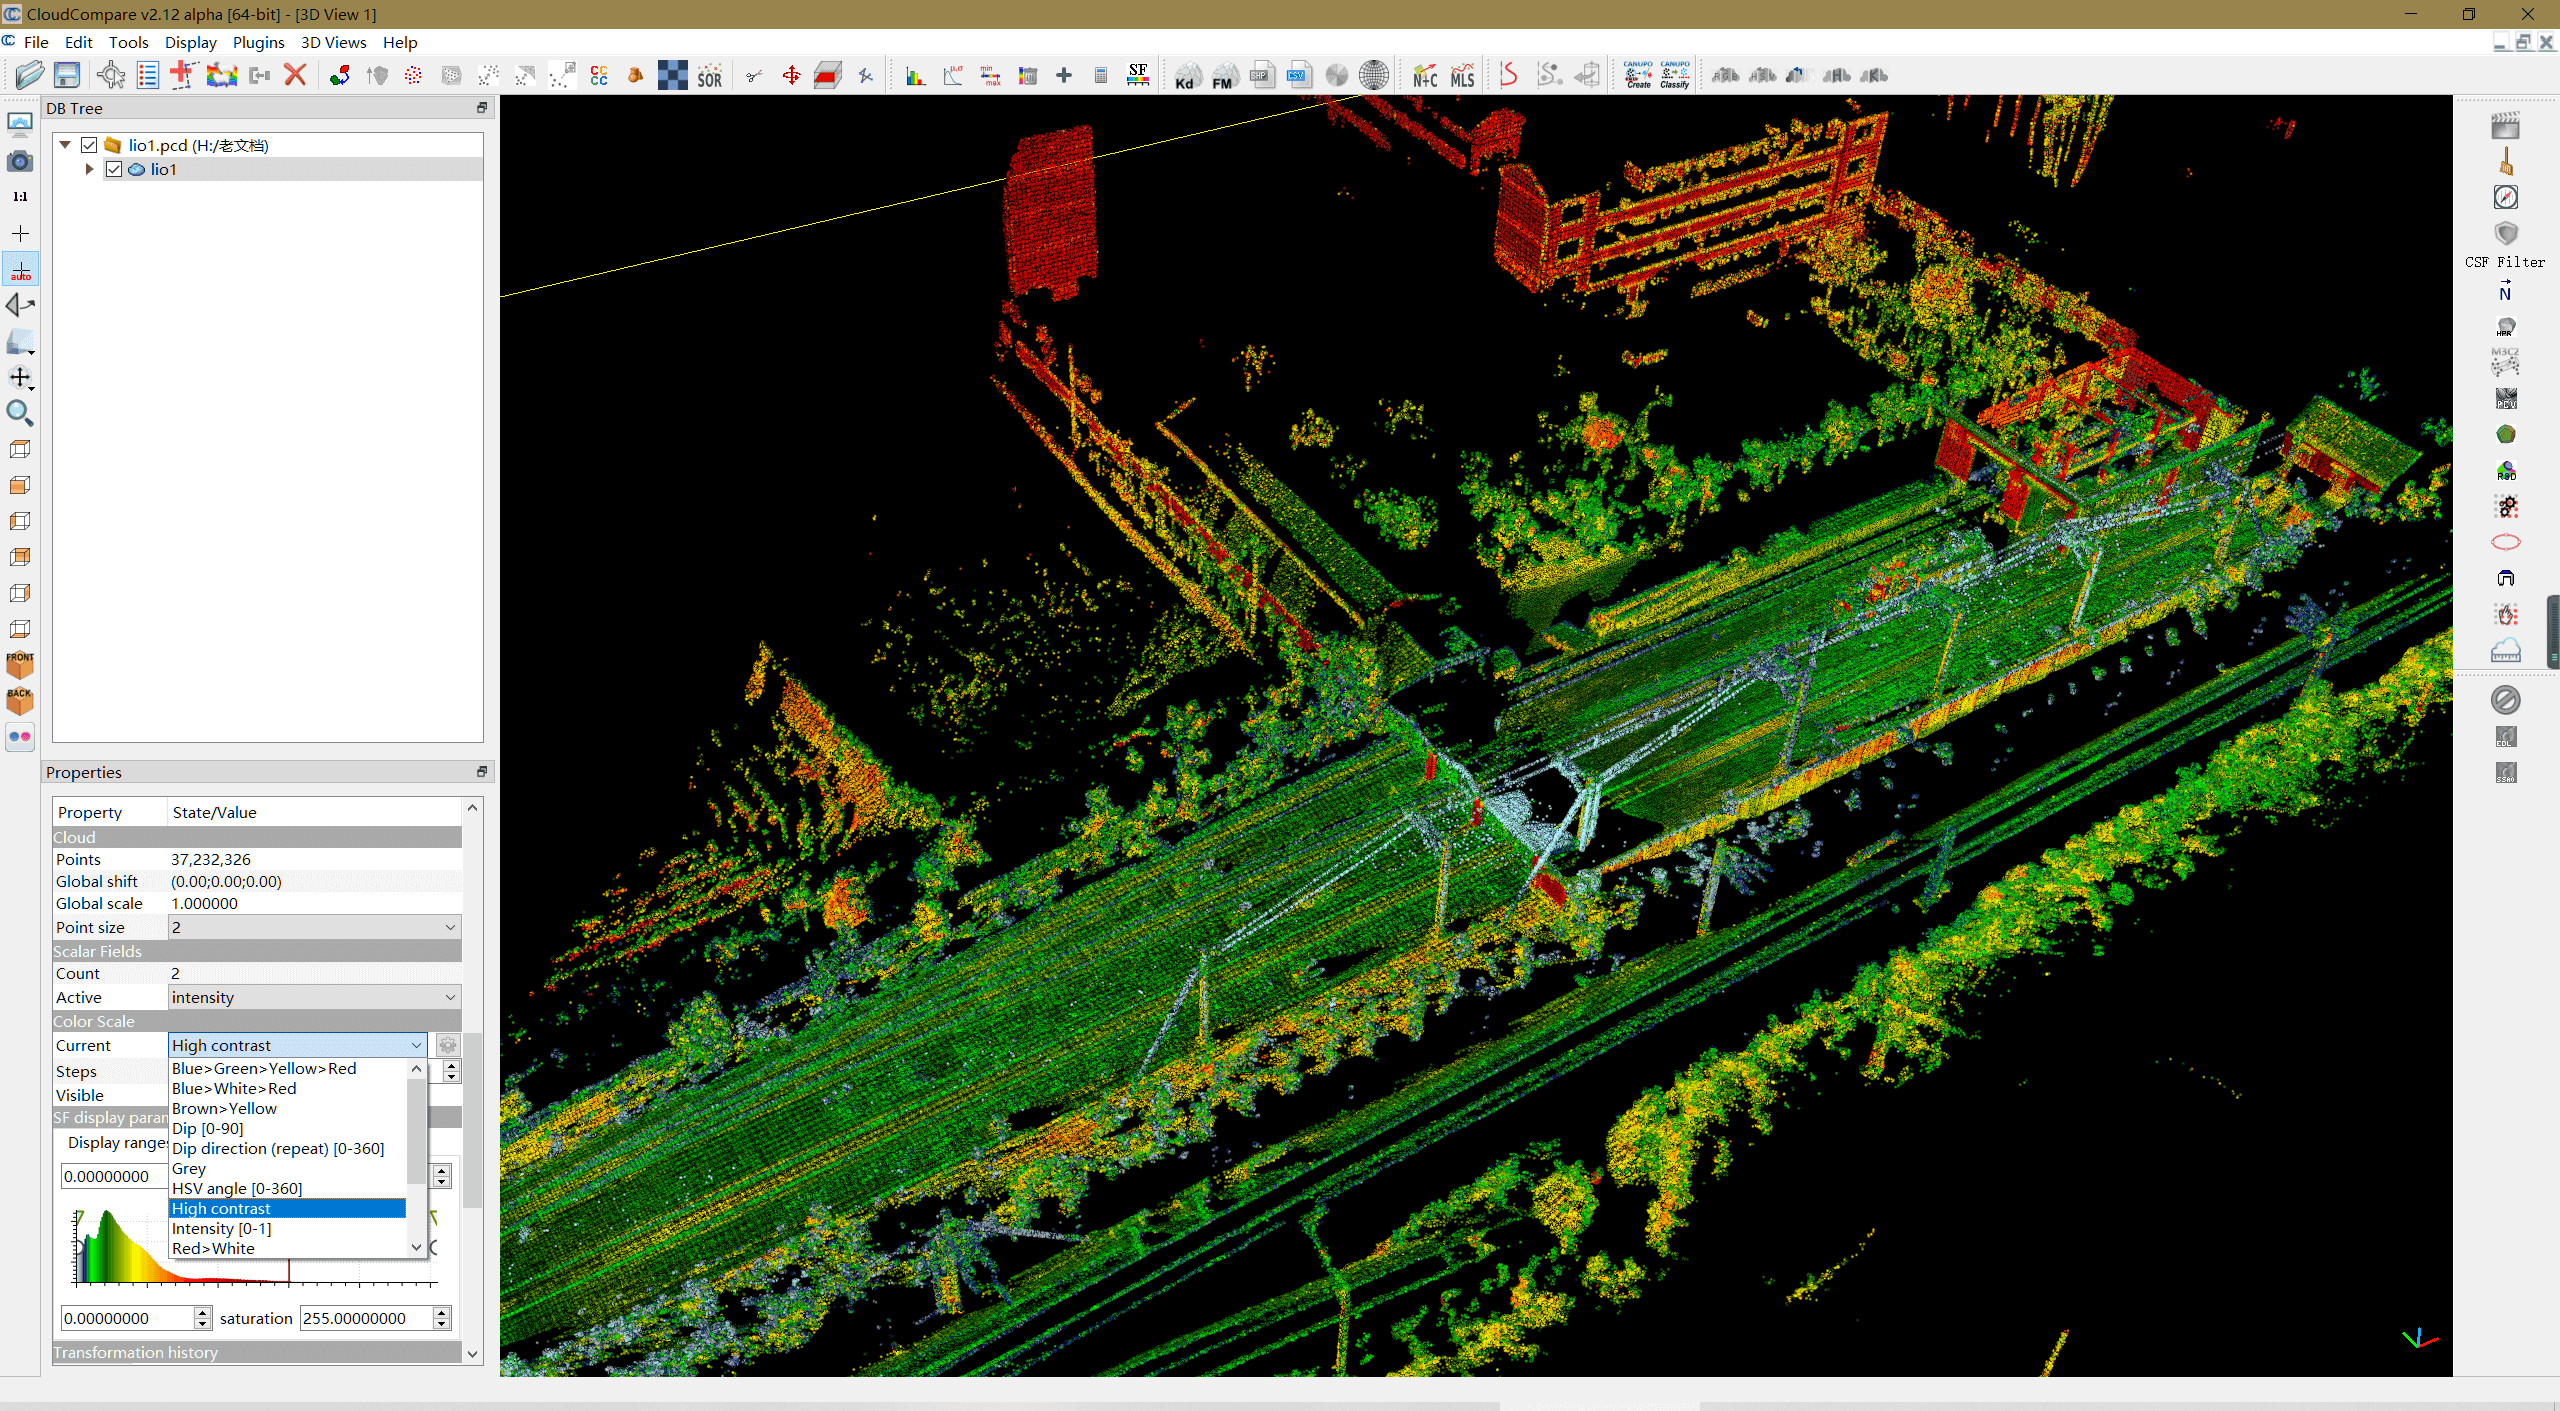
Image 5 The configuration interface
Because of the high-precision algorithms developed for the project and the high-density point clouds of Livox, the images below show that even if a train travels at a high speed up to 70 km/h, tiny objects such as the holes on the towers, railway signals, and junctions can be easily seen.
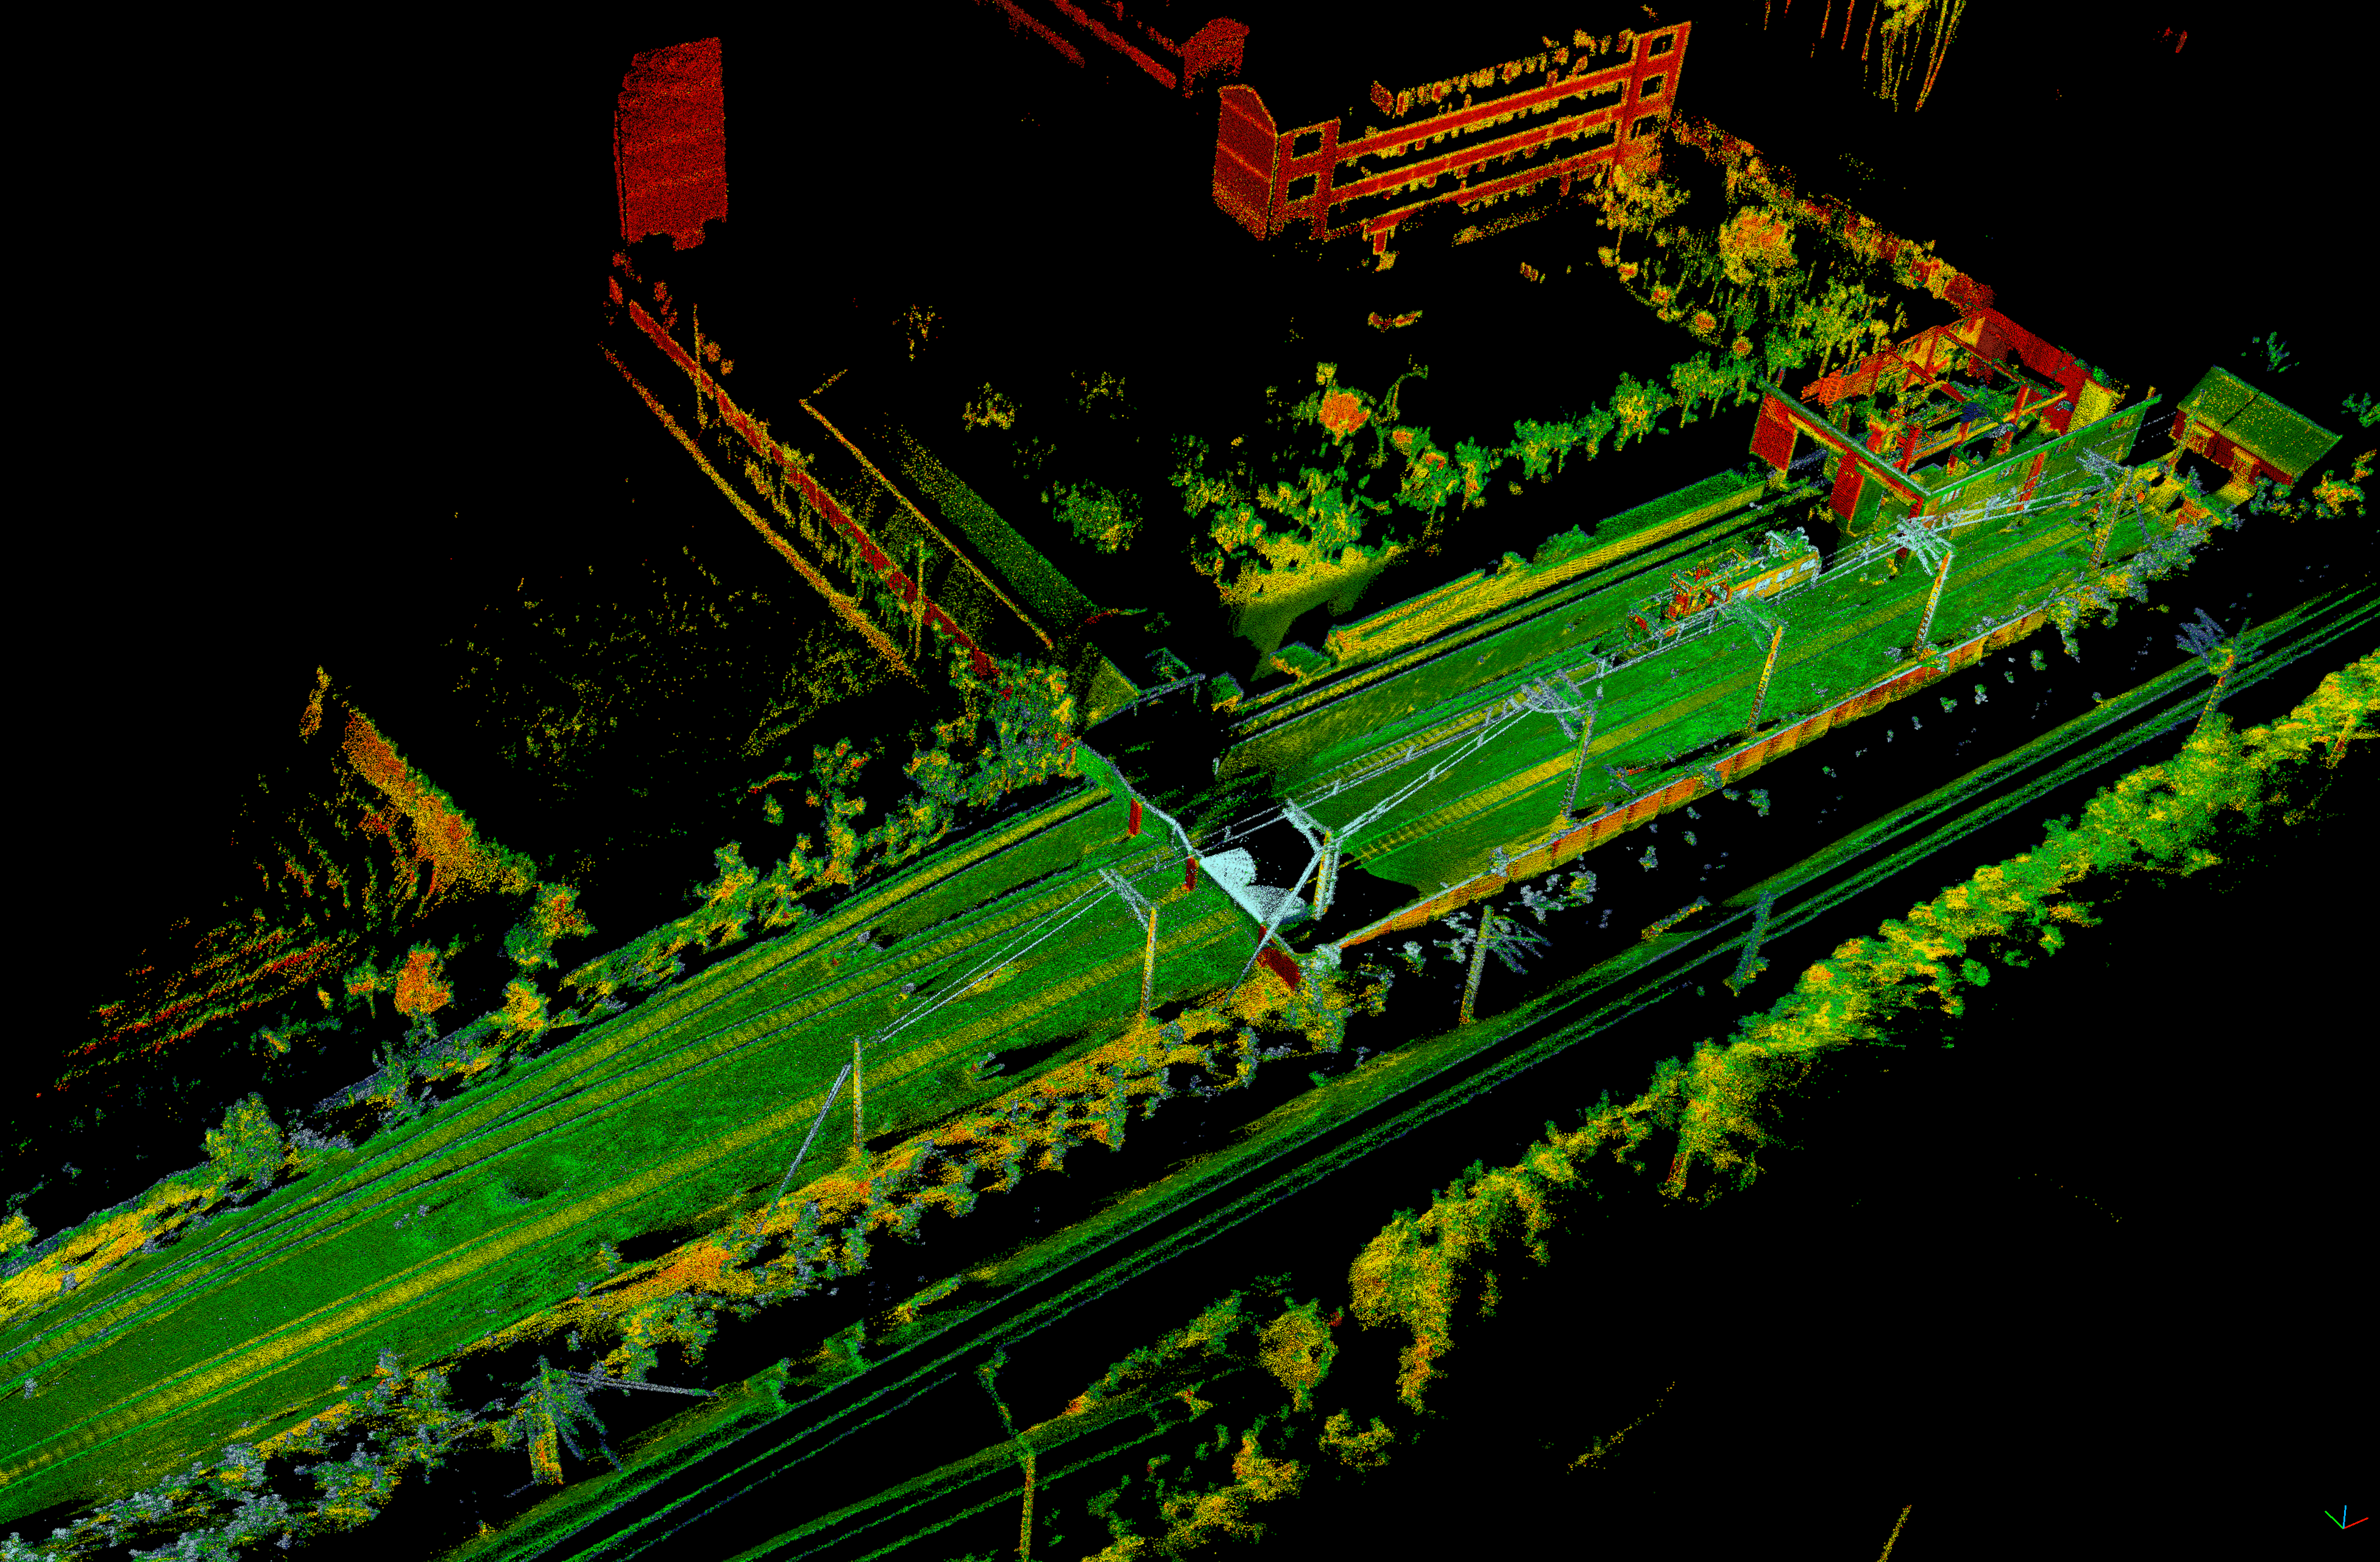
Image 6.1 Optimized point-cloud map
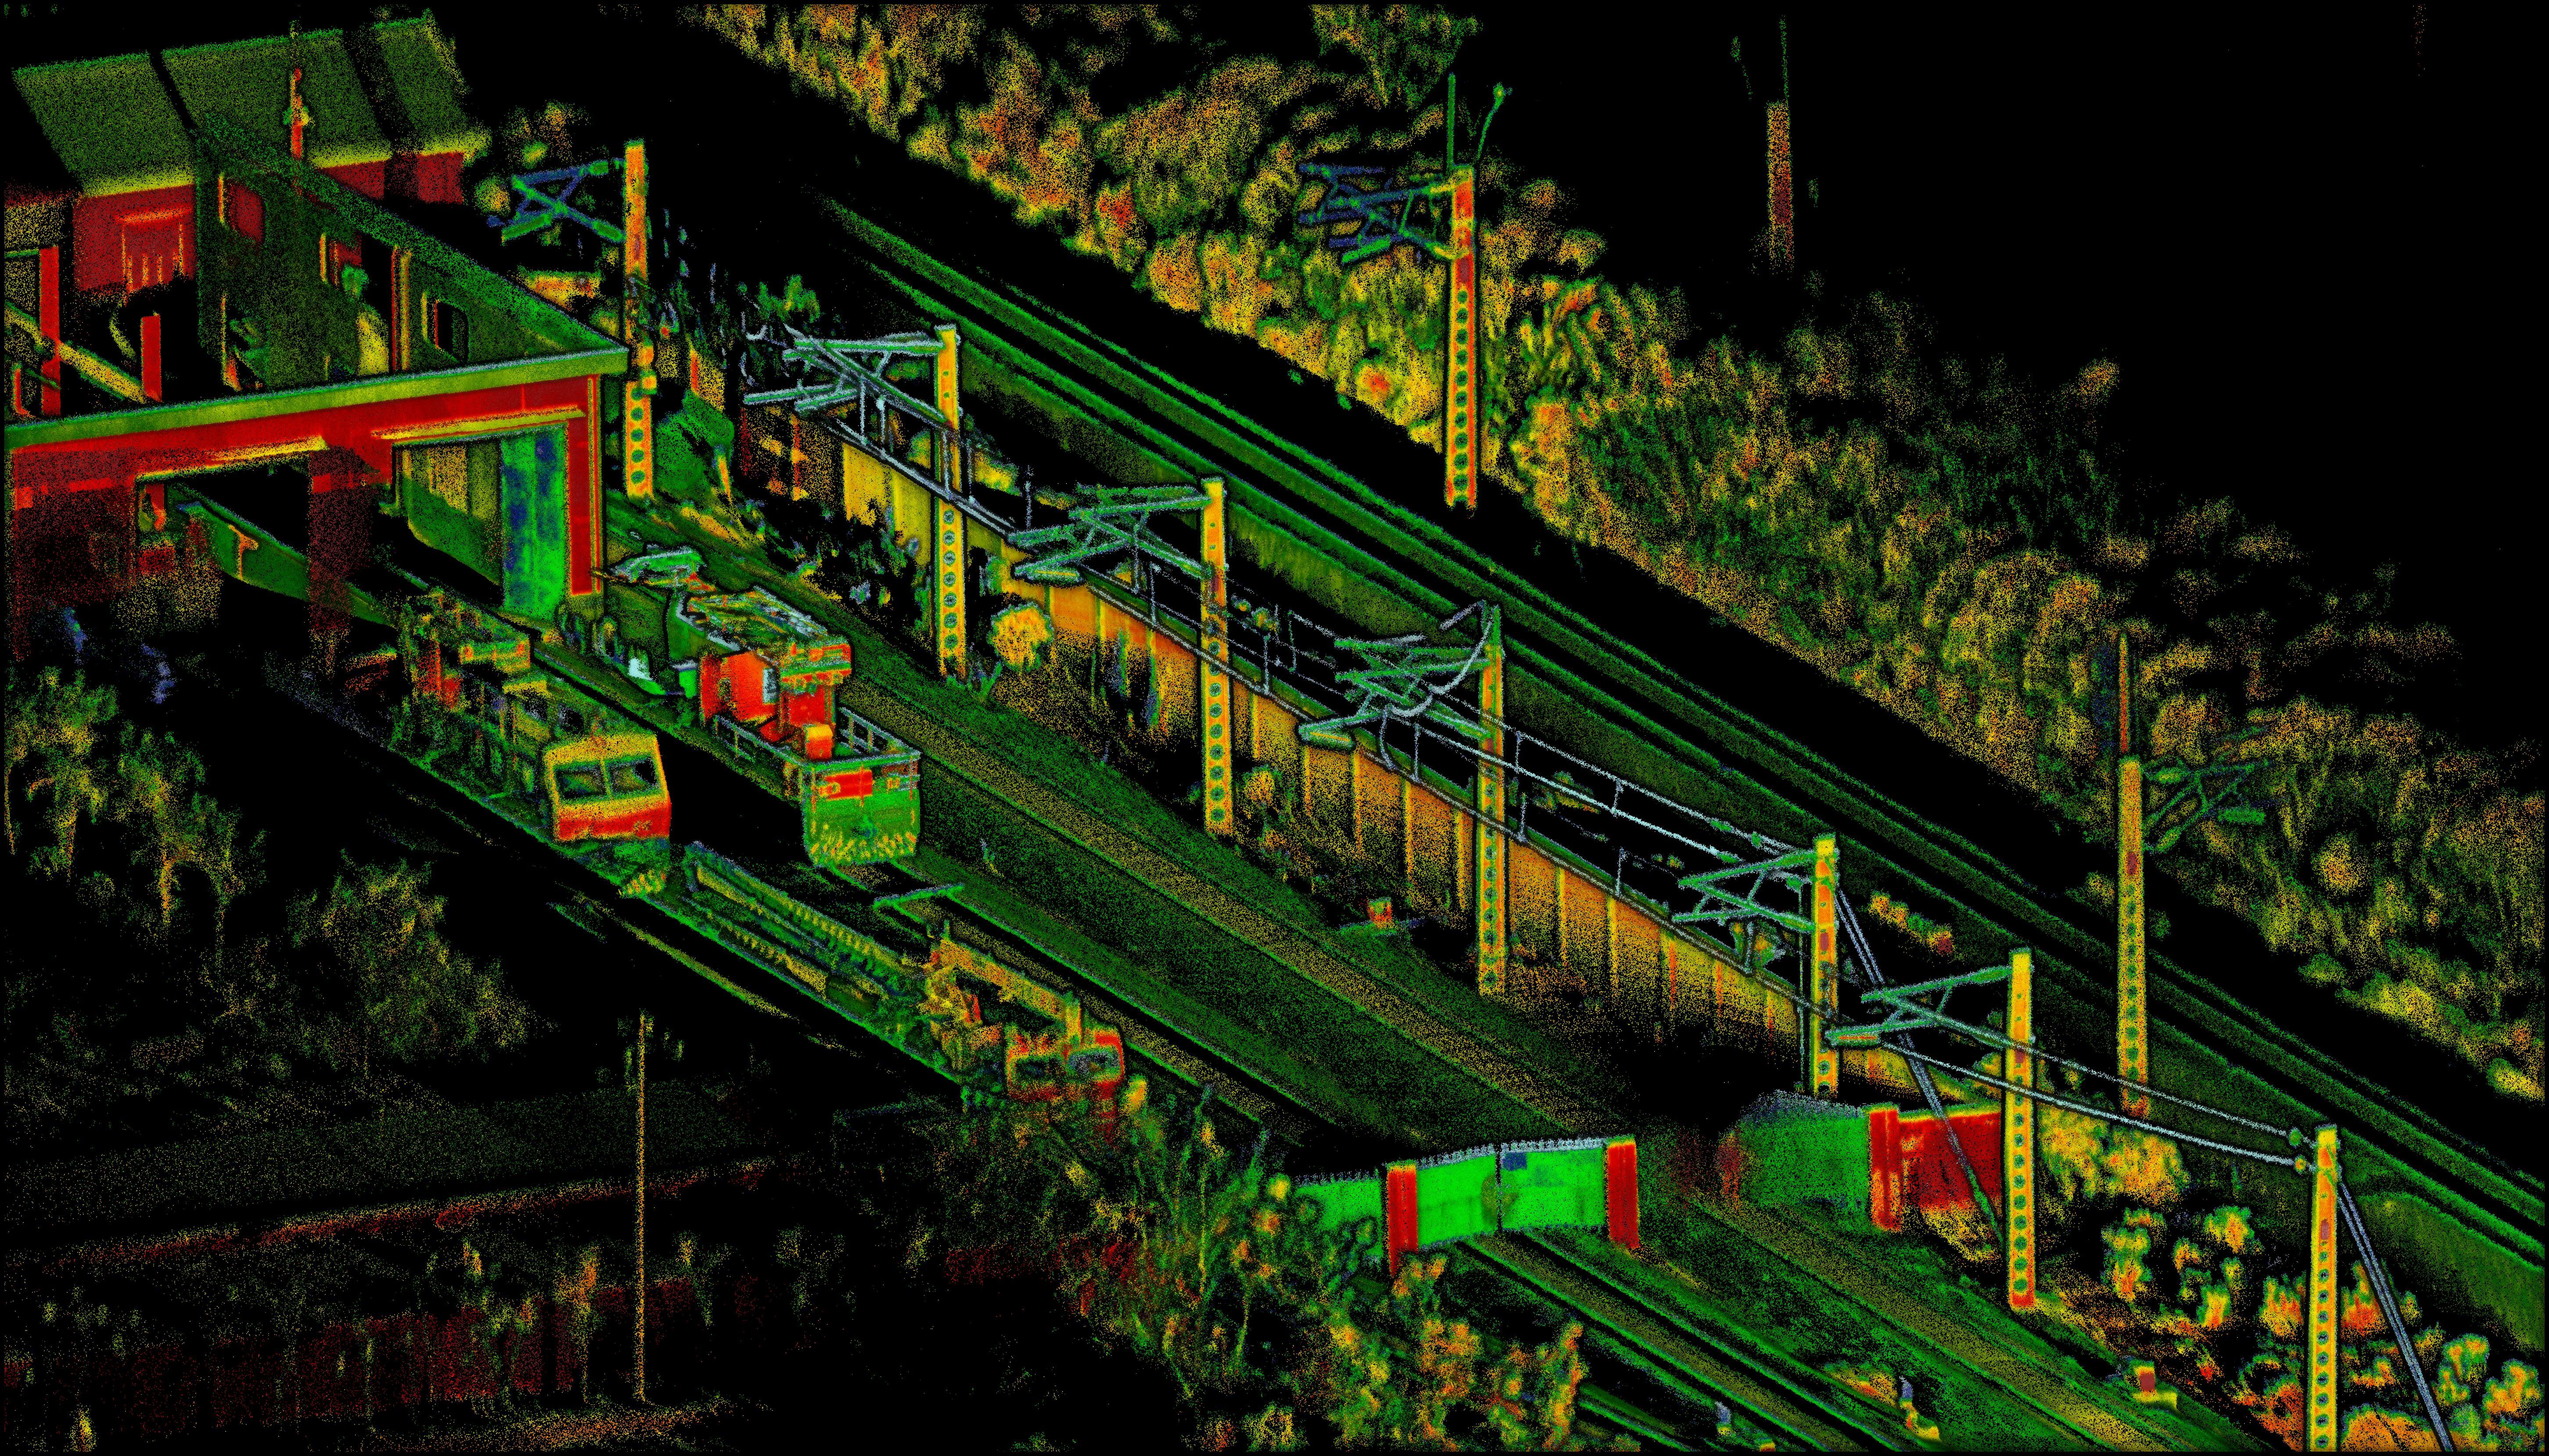
Image 6.2 The white power lines and transmission poles are easily distinguishable, making it easier to map the cables
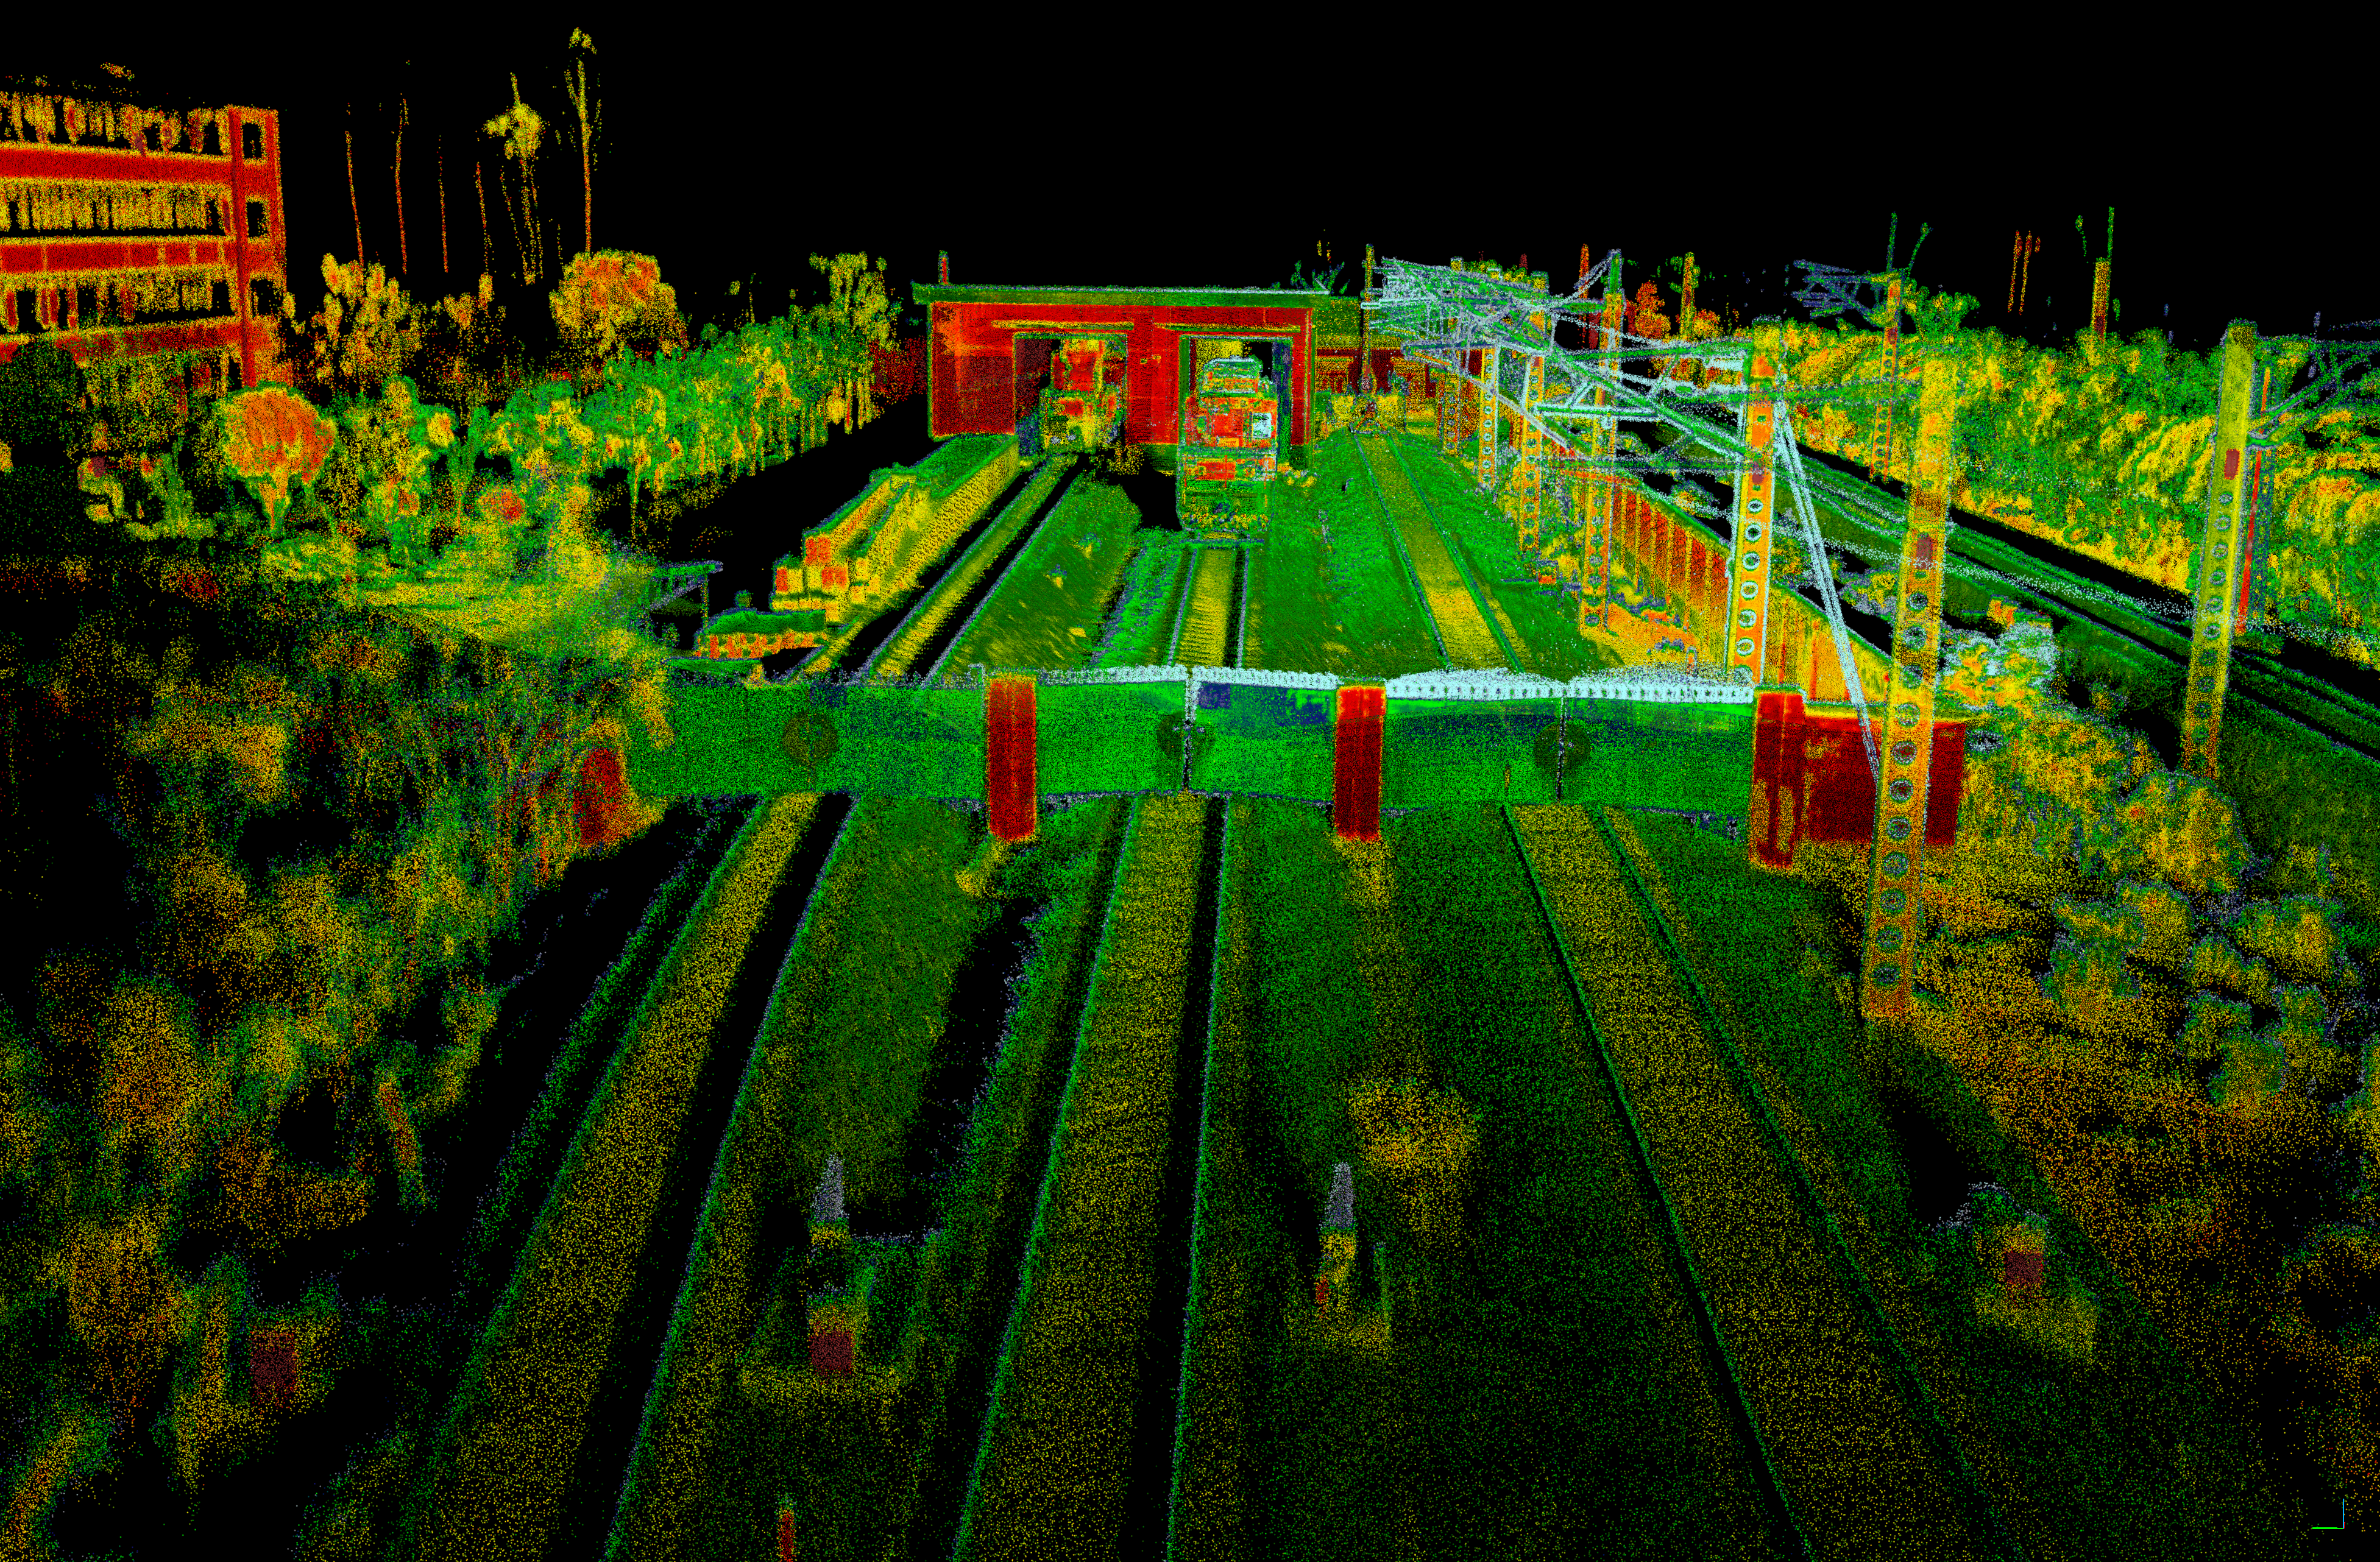
Image 6.3 The spikes on top of the gates are distinguishable and in sharp contrast with the rusty gates
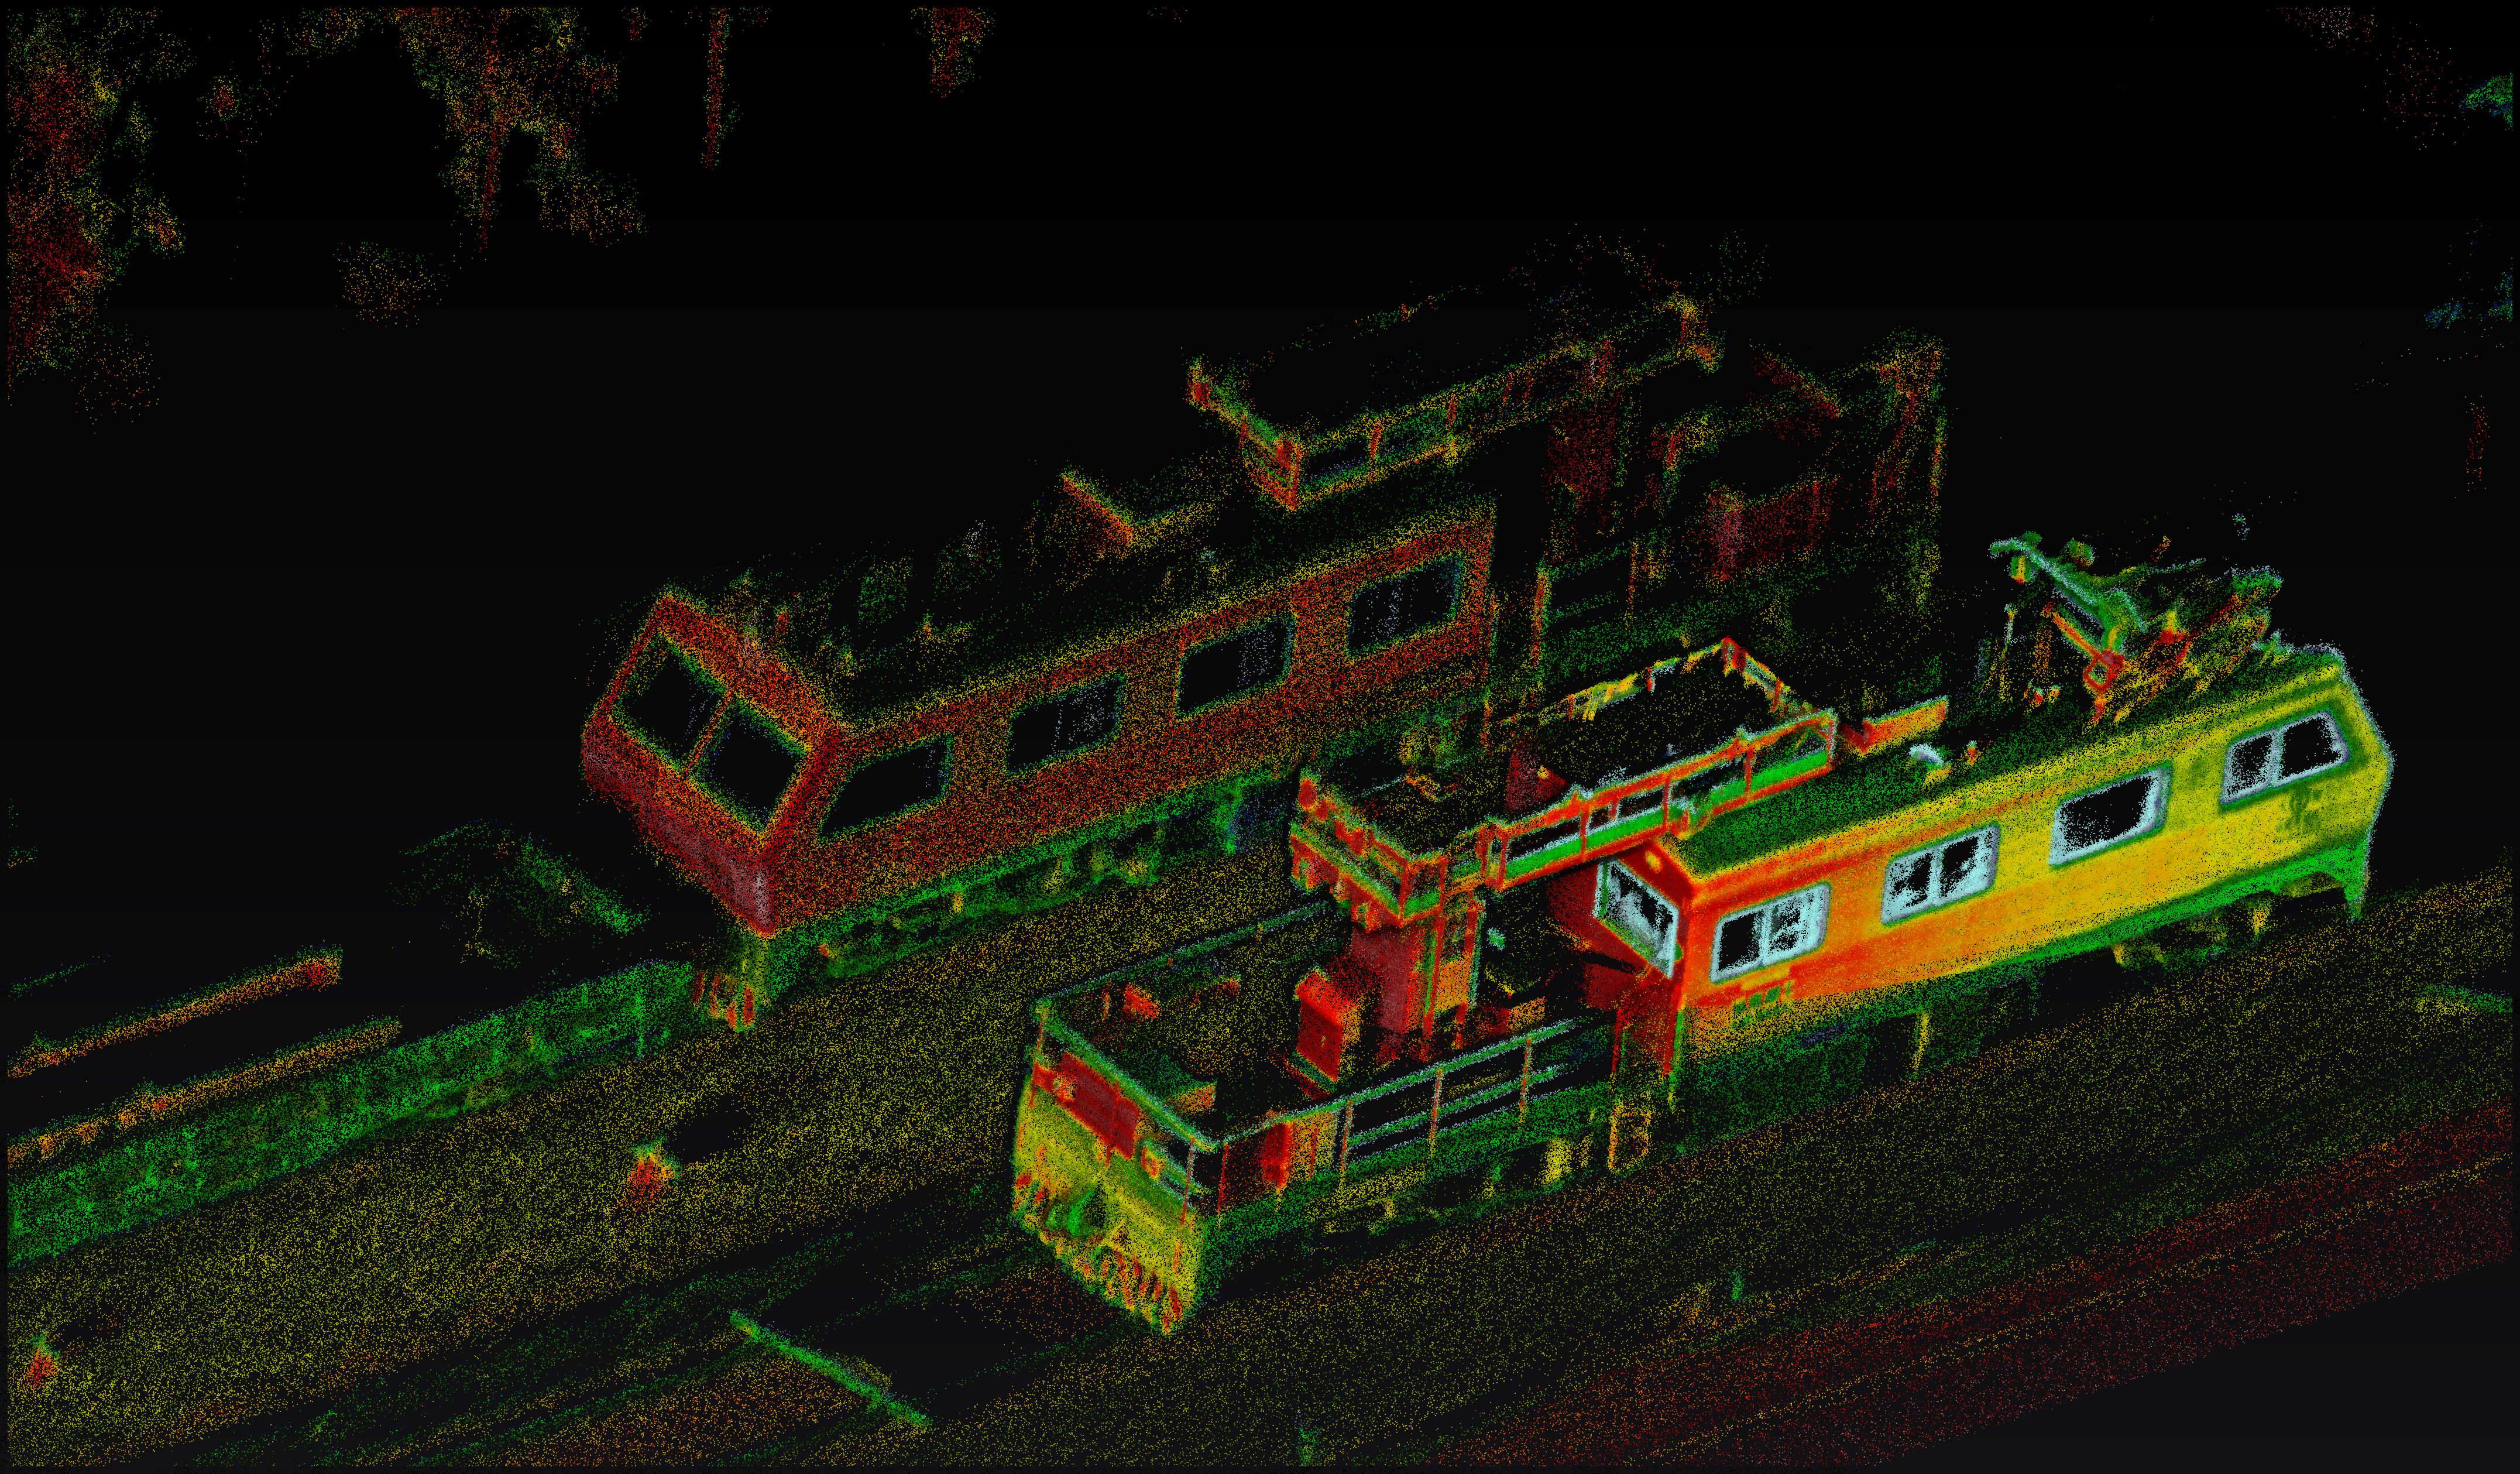
Image 6.4 The railway service cars have a clear outline, with the half-open and fully open glass windows even visible to the naked eye, and the sleepers behind the cars form a sharp contrast with the reflective metal.
To test the wider applicability of this method, the team used different lidars to generate maps of multiple scenes such as tunnels and road surface markings based on their reflectivity, and compared their display quality. They then applied the above method in a highway scenario to optimize the visual output.
Point cloud comparison for tunnels
In railway tunnels, drivers usually position and inspect their railcars through the identification numbers on the power poles. Therefore, good detection and display of power poles is crucial for the construction of a tunnel reference map.
In this test, the team created maps using the following four different lidars, including Livox Horizon. The Rail-SLAM algorithms, developed by the project team, were applied to the latter three lidars, and all output results were generated based on their default reflectivity.
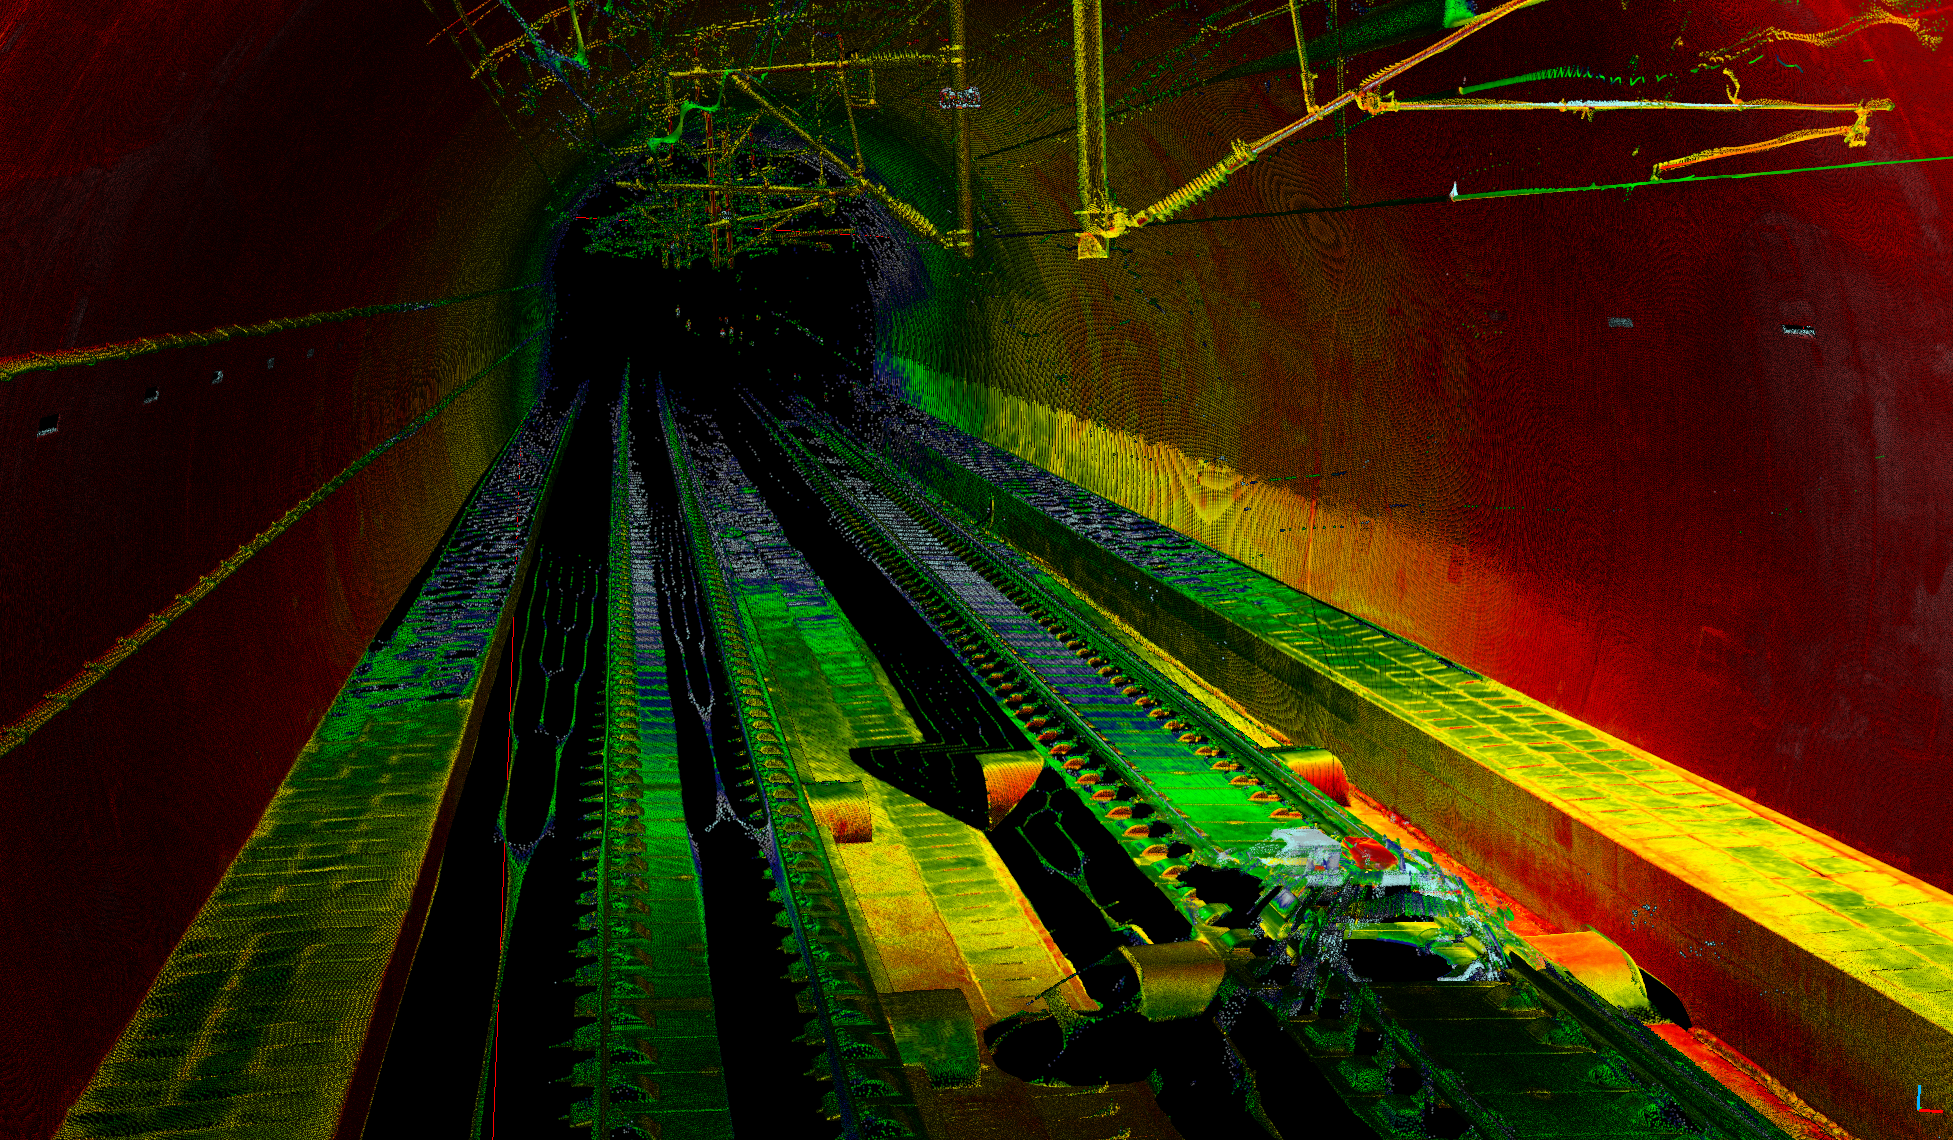
Image 7.1 Post-processed image generated using premium mapping-grade laser scanners and professional-grade navigation equipment
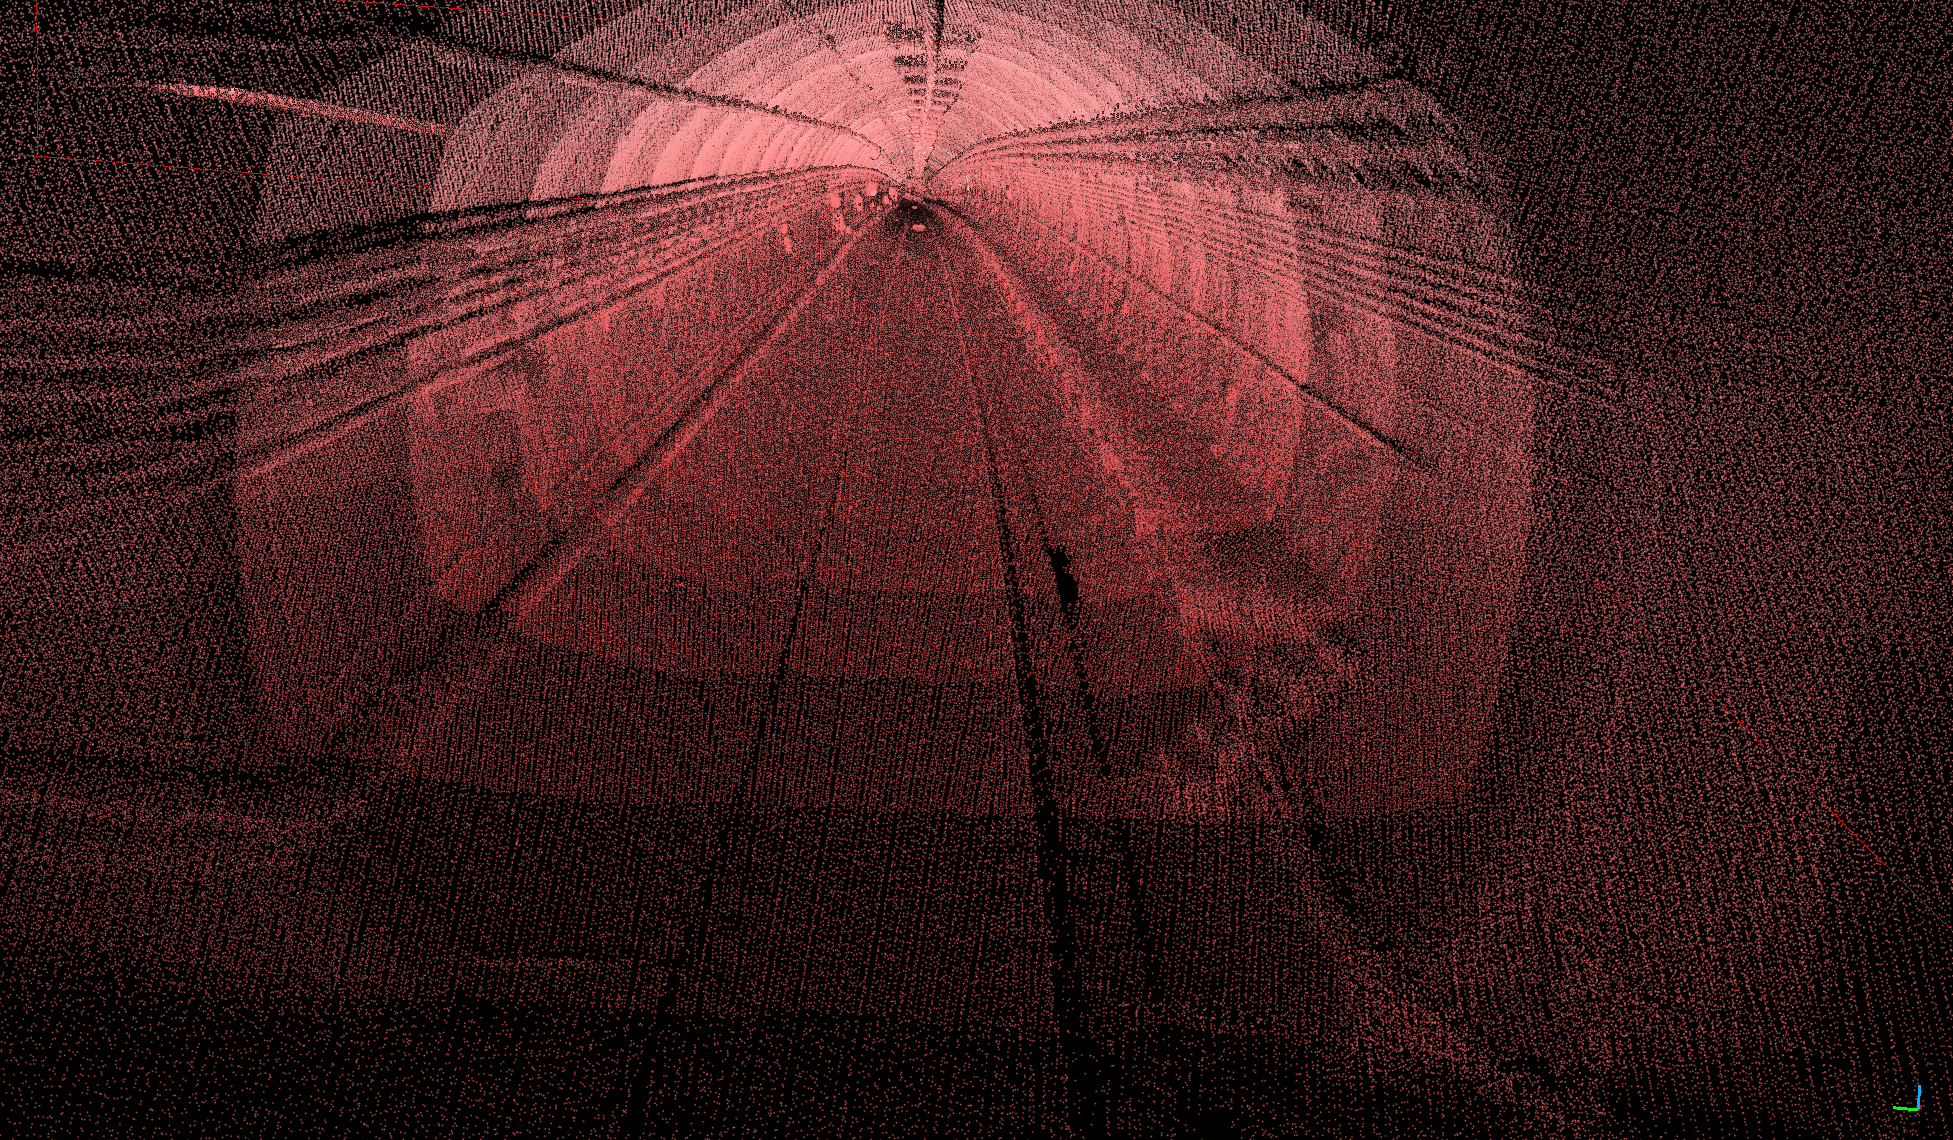
Image 7.2 Image generated by a high-beam semi-solid state lidar commonly used in intelligent traffic applications
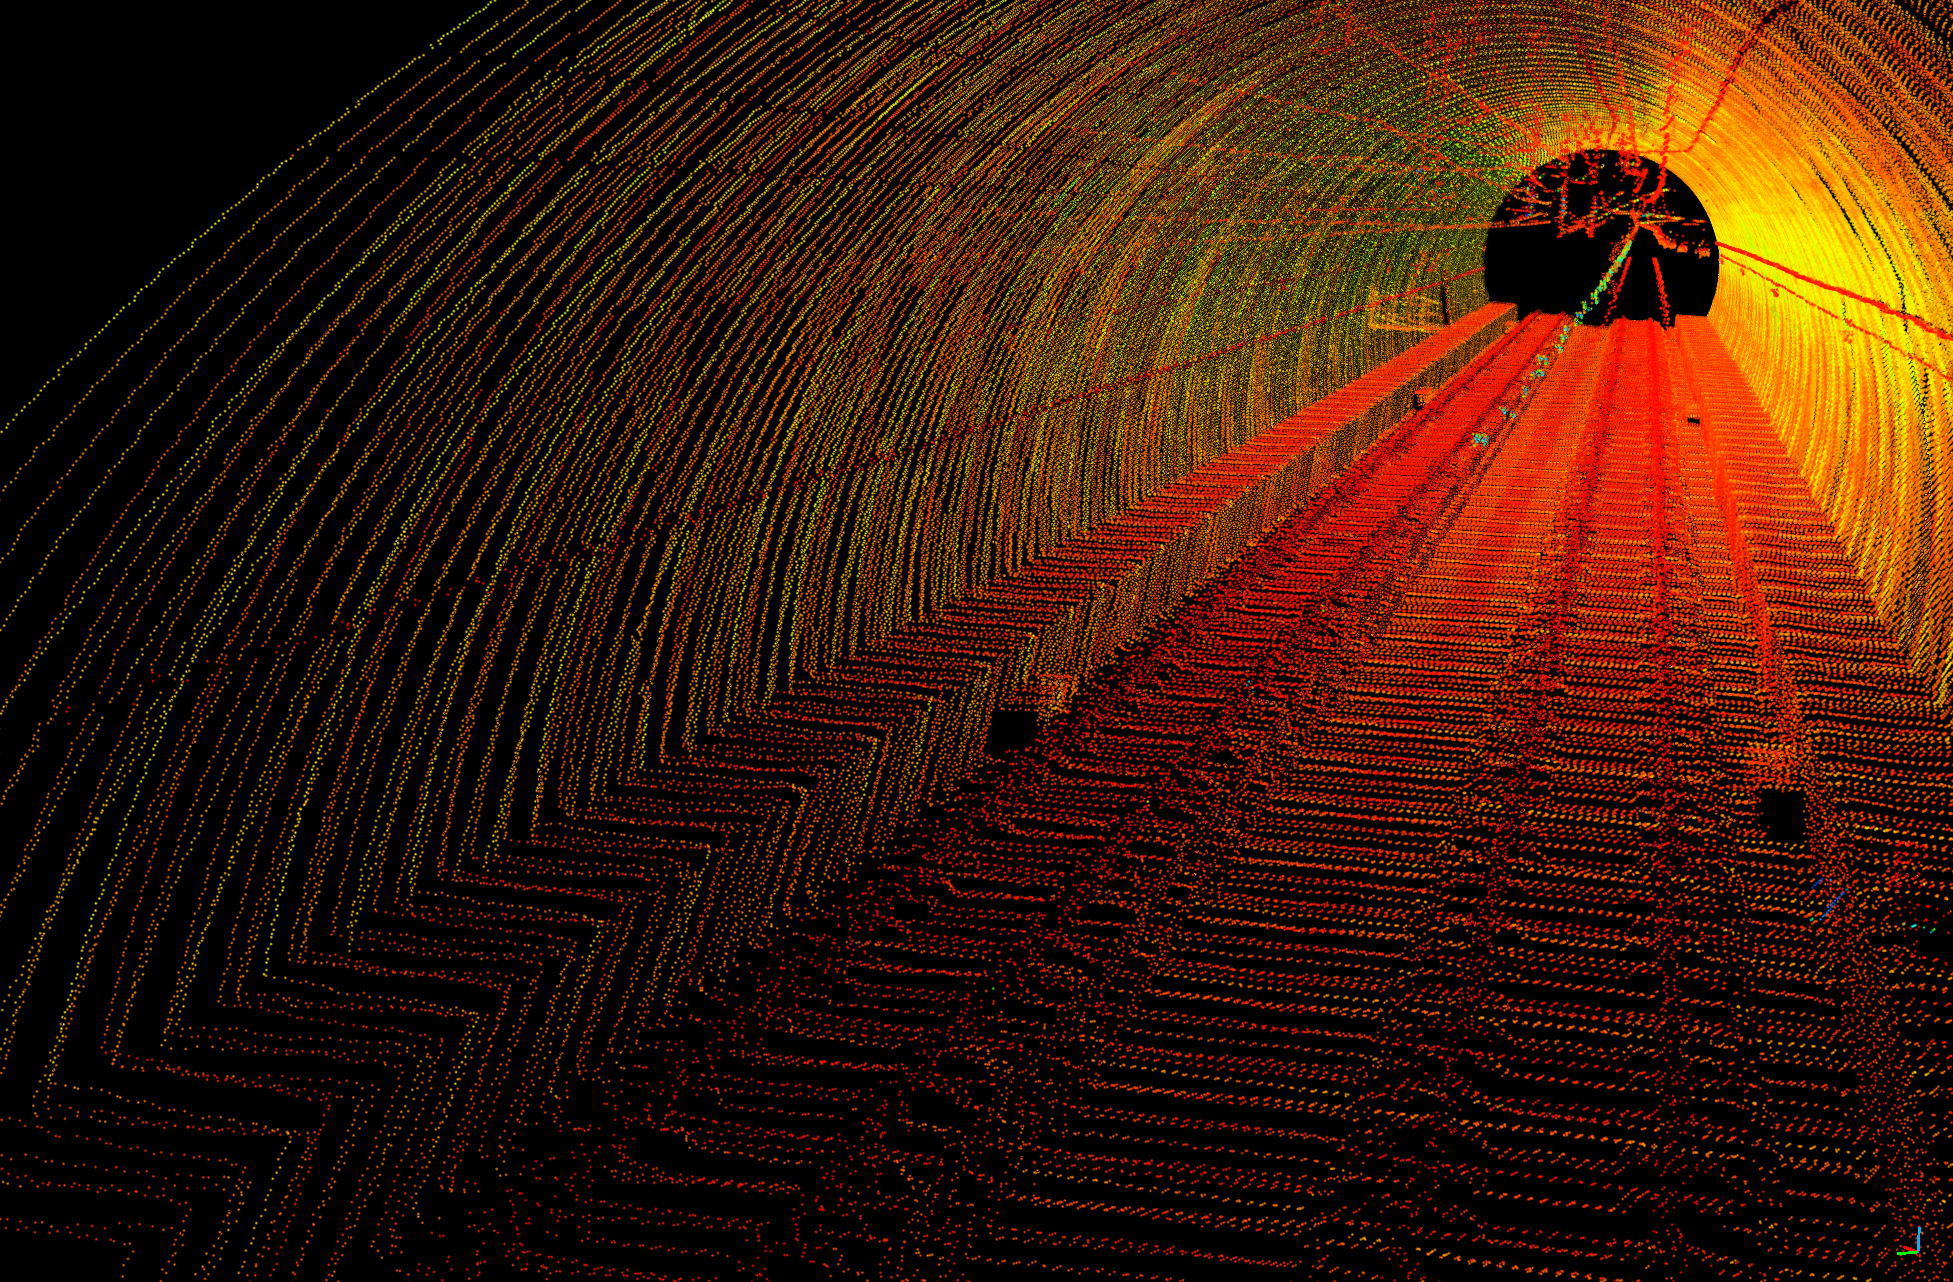
Image 7.3 Image generated by a traditional mechanical 16-beam lidar
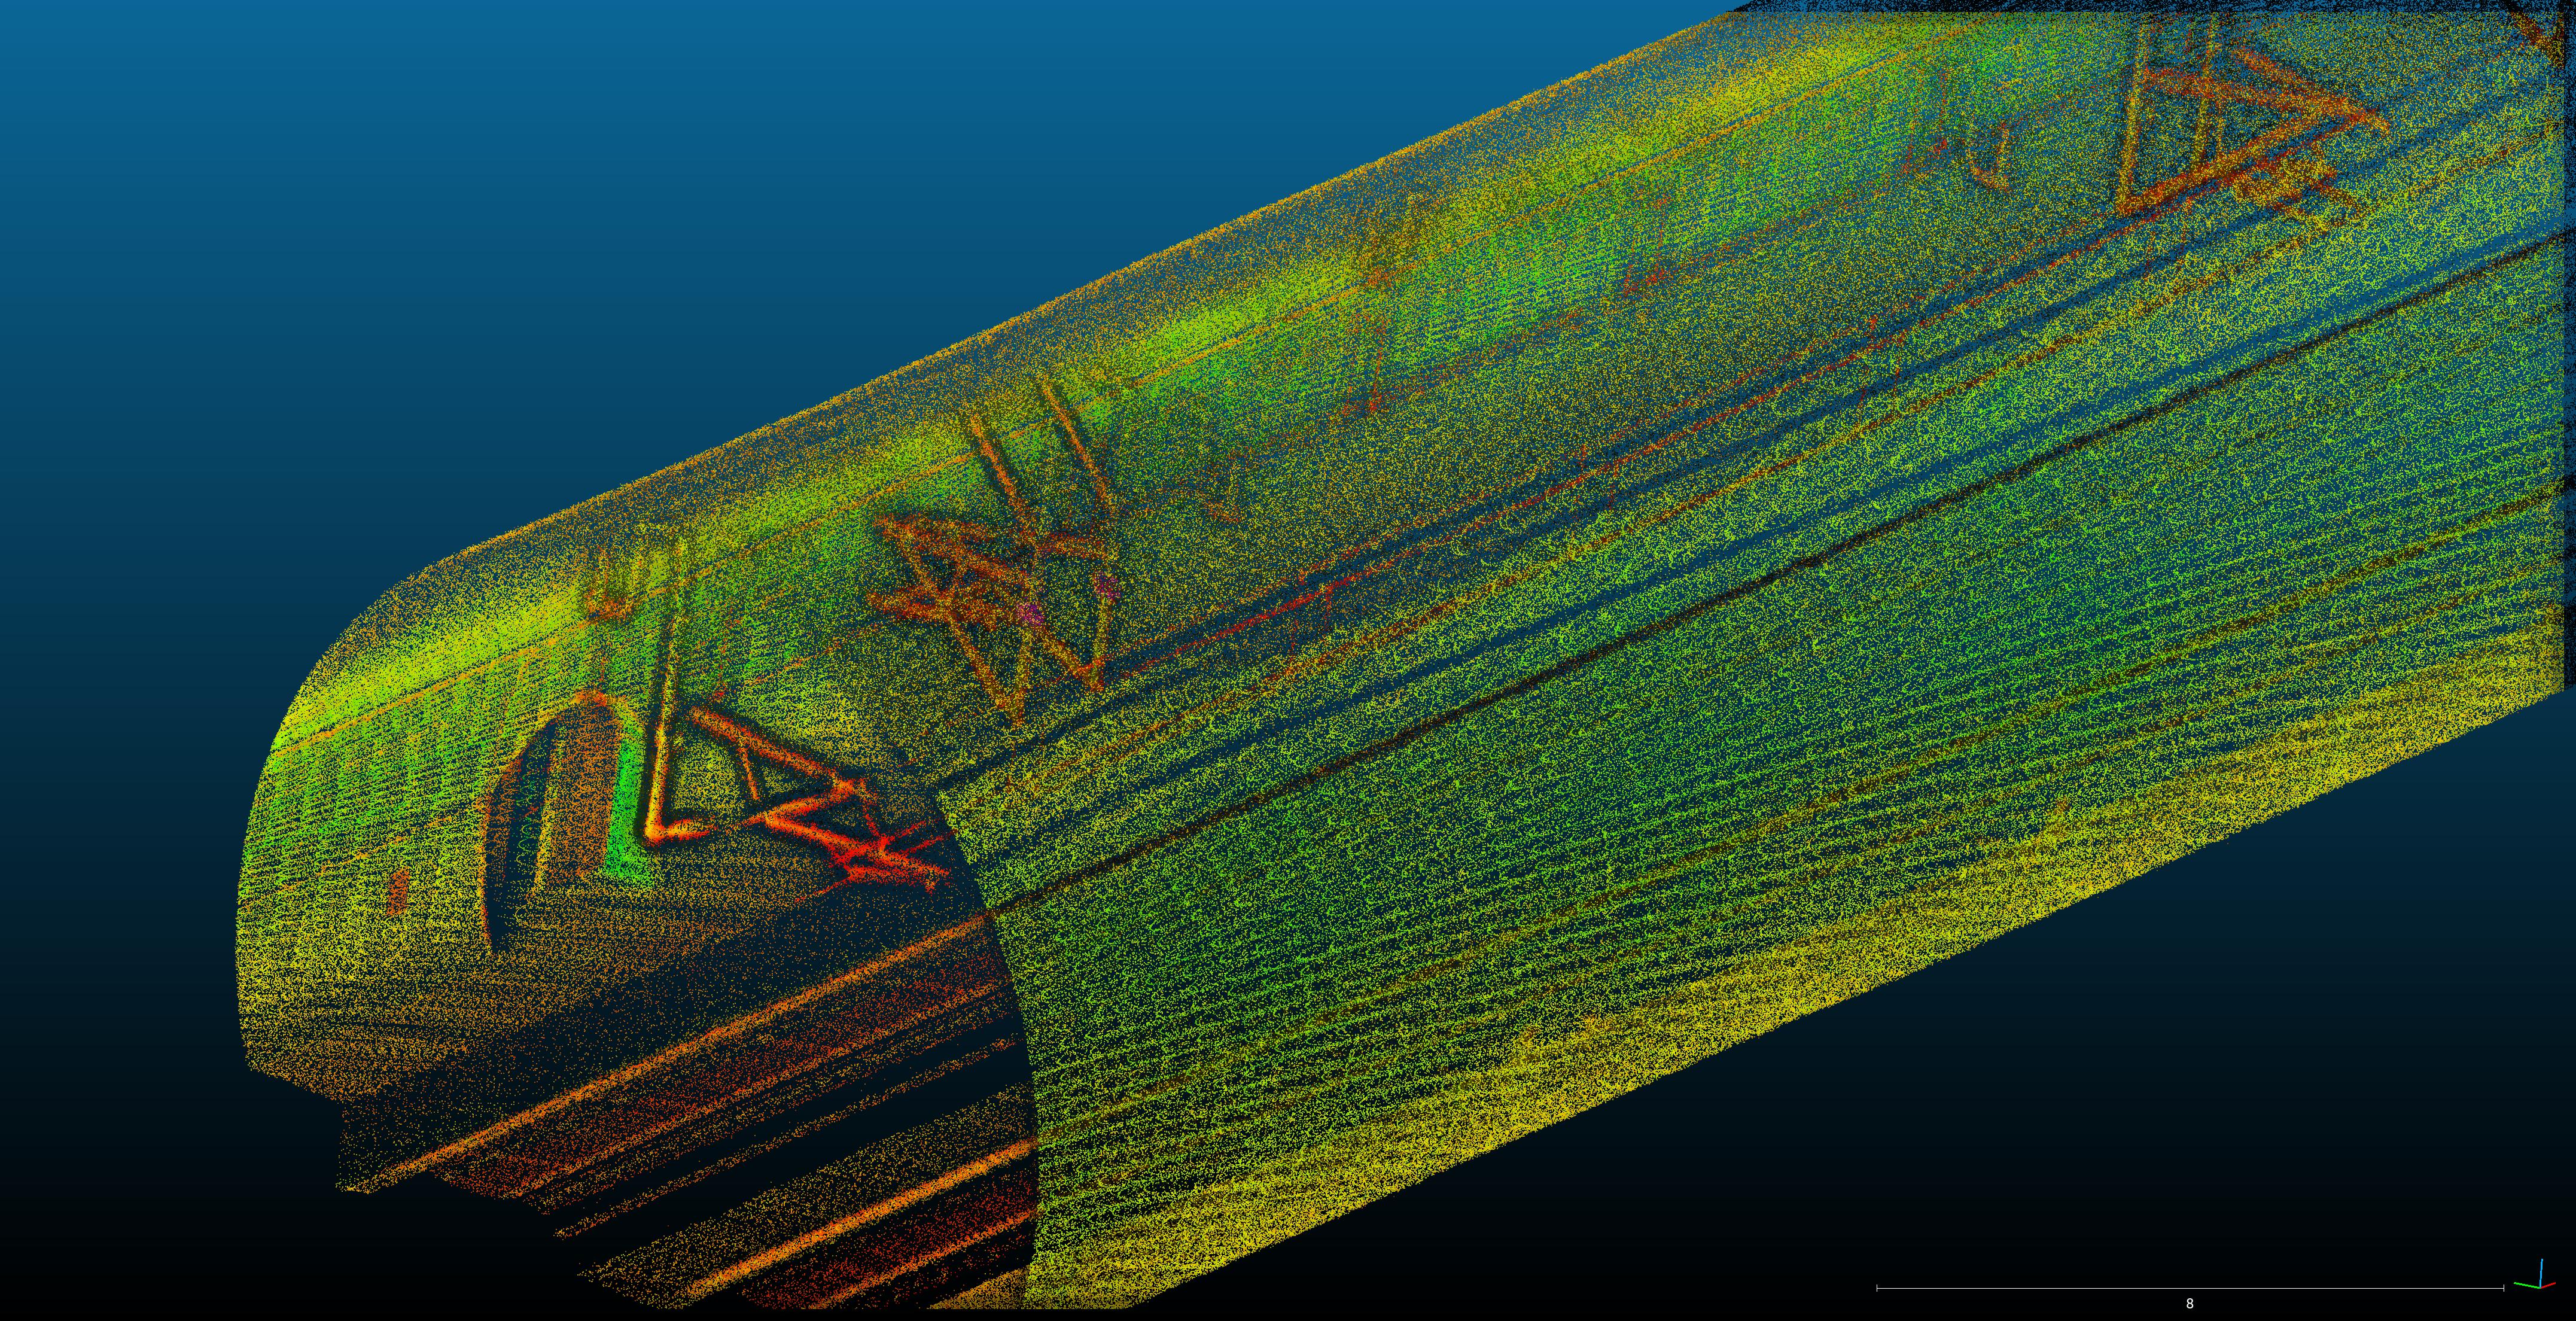
Image 7.4 Mapping by Livox Horizon
As shown in the image above, the map generated by Livox Horizon can already distinguish features such as the railway tracks and poles due to its high-precision measurement of reflectivity.
Road Markings Detection
Based on their extensive test experience, the team found that many lidars in the market are not able to distinguish road surface markings using default reflectivity, especially faint markings. Based on tests of the following real-time output generated by different lidars on RViz, 16 or 32-beam traditional mechanical lidars (i.e., fewer beams) are essentially unable to detect road surface markings and diamond-shaped road signs.
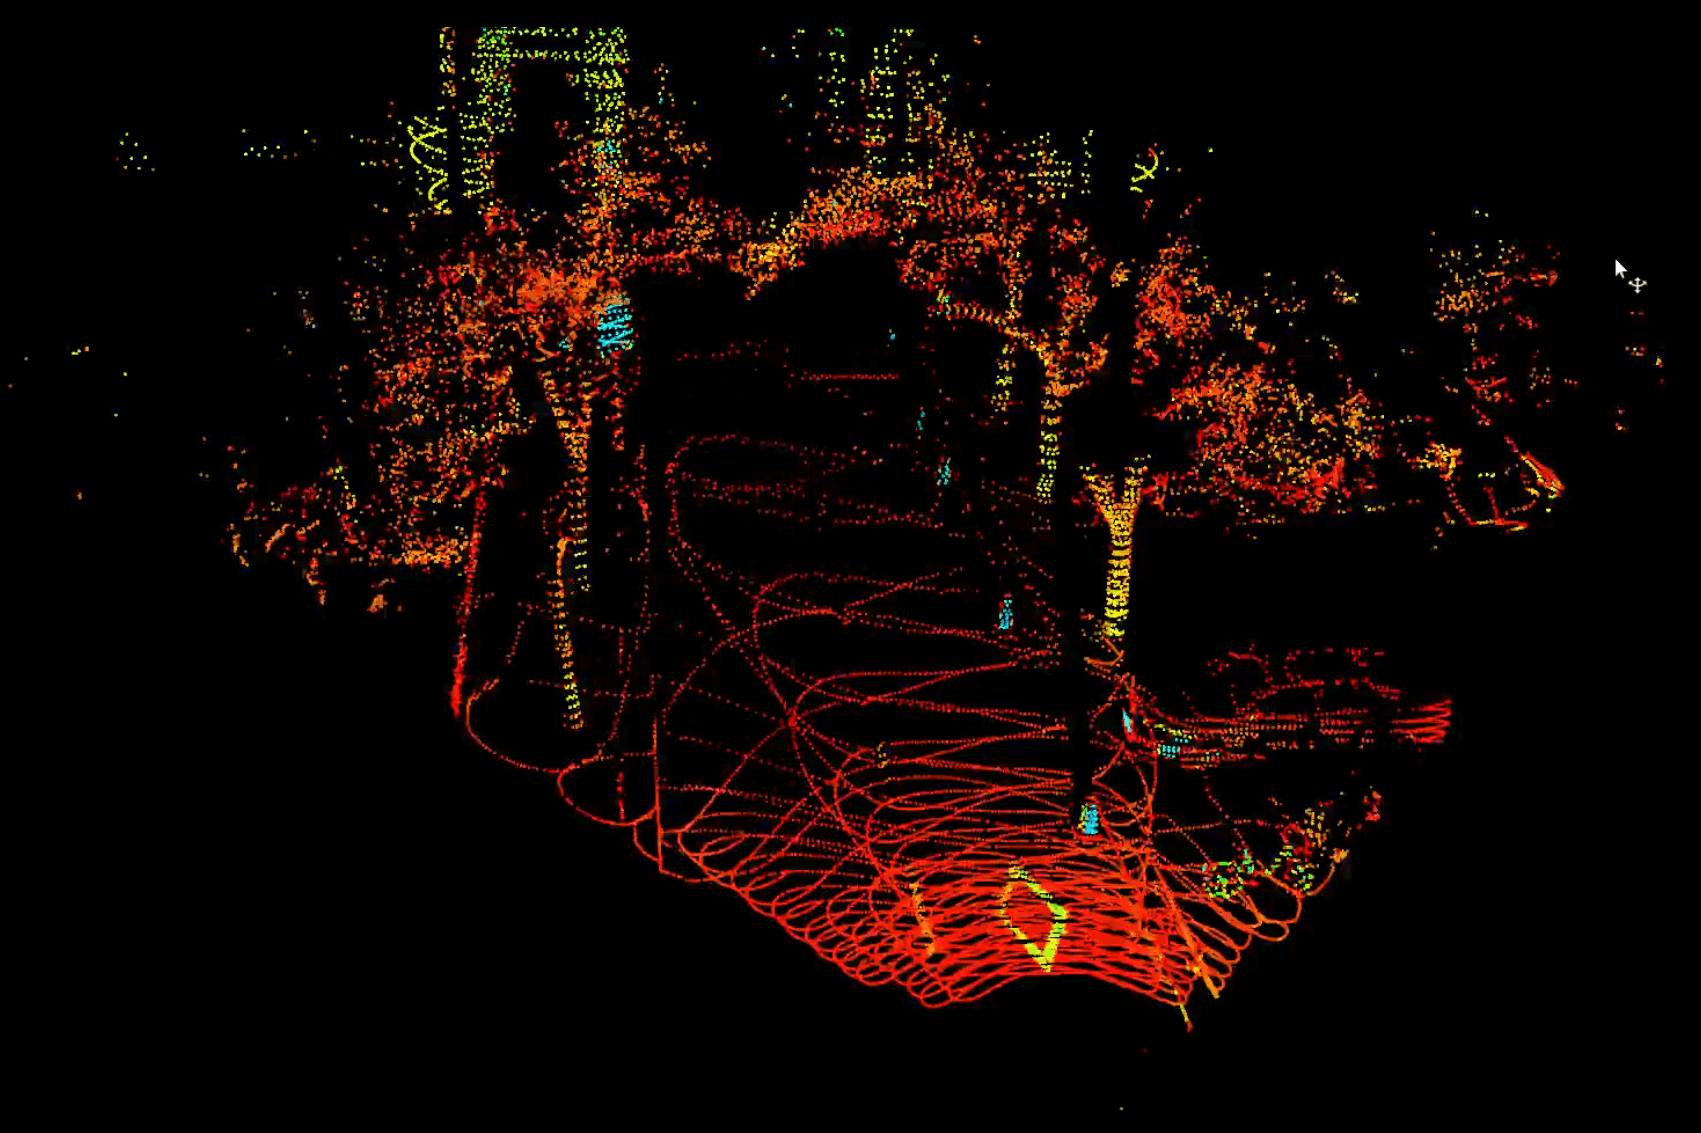
Image 8.1 Detection output by Livox Horizon
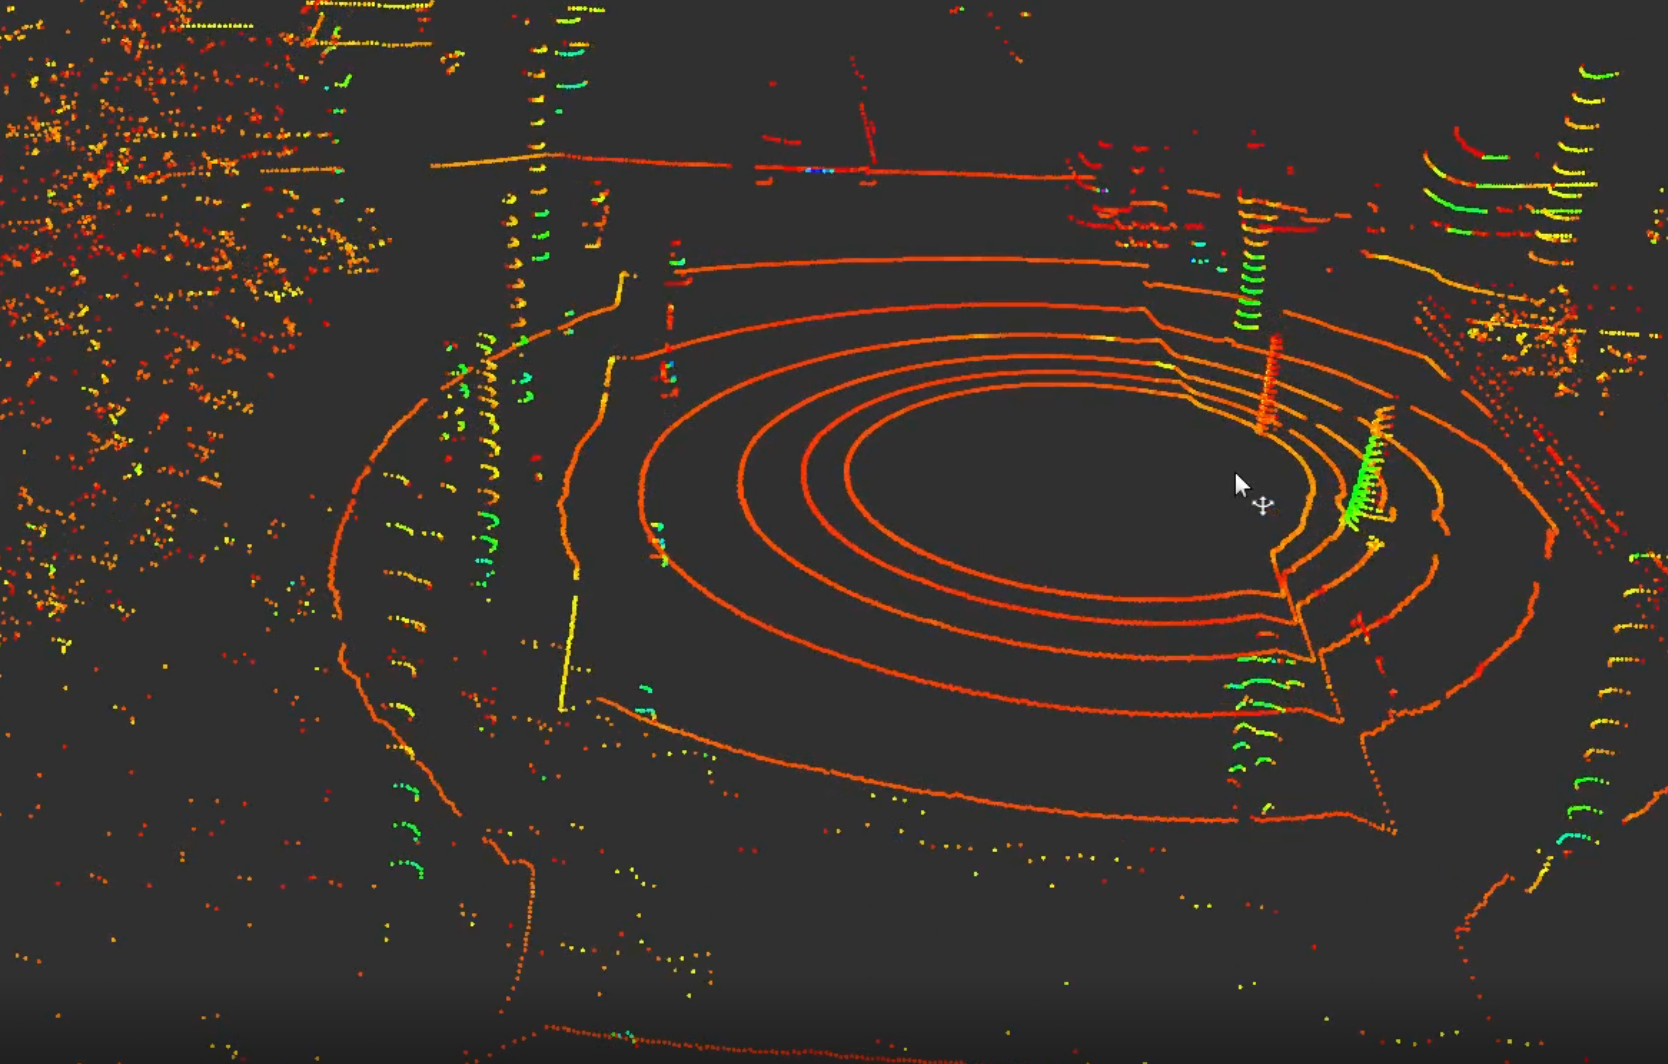
Image 8.2 Detection output by a traditional 16-beam lidar
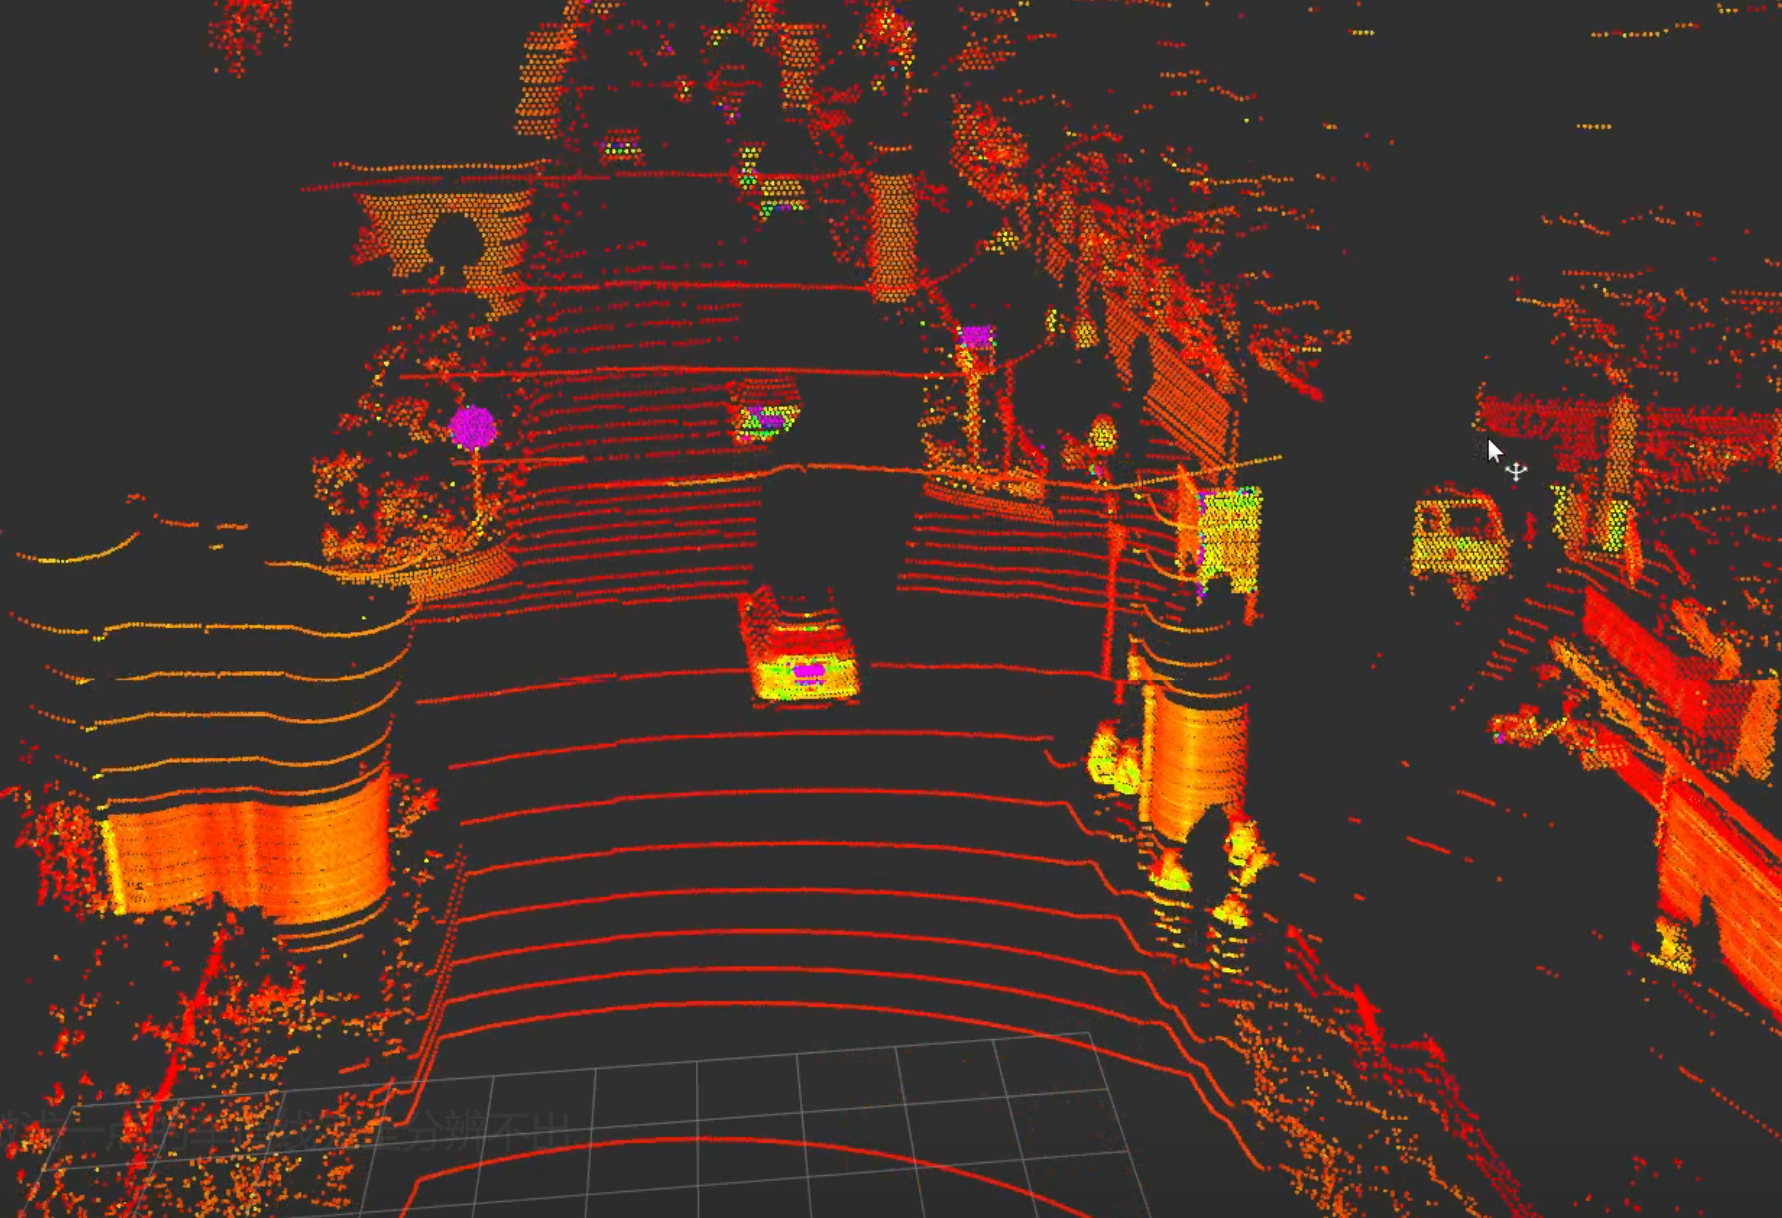
Image 8.3 Detection output by a traditional 40-beam lidar
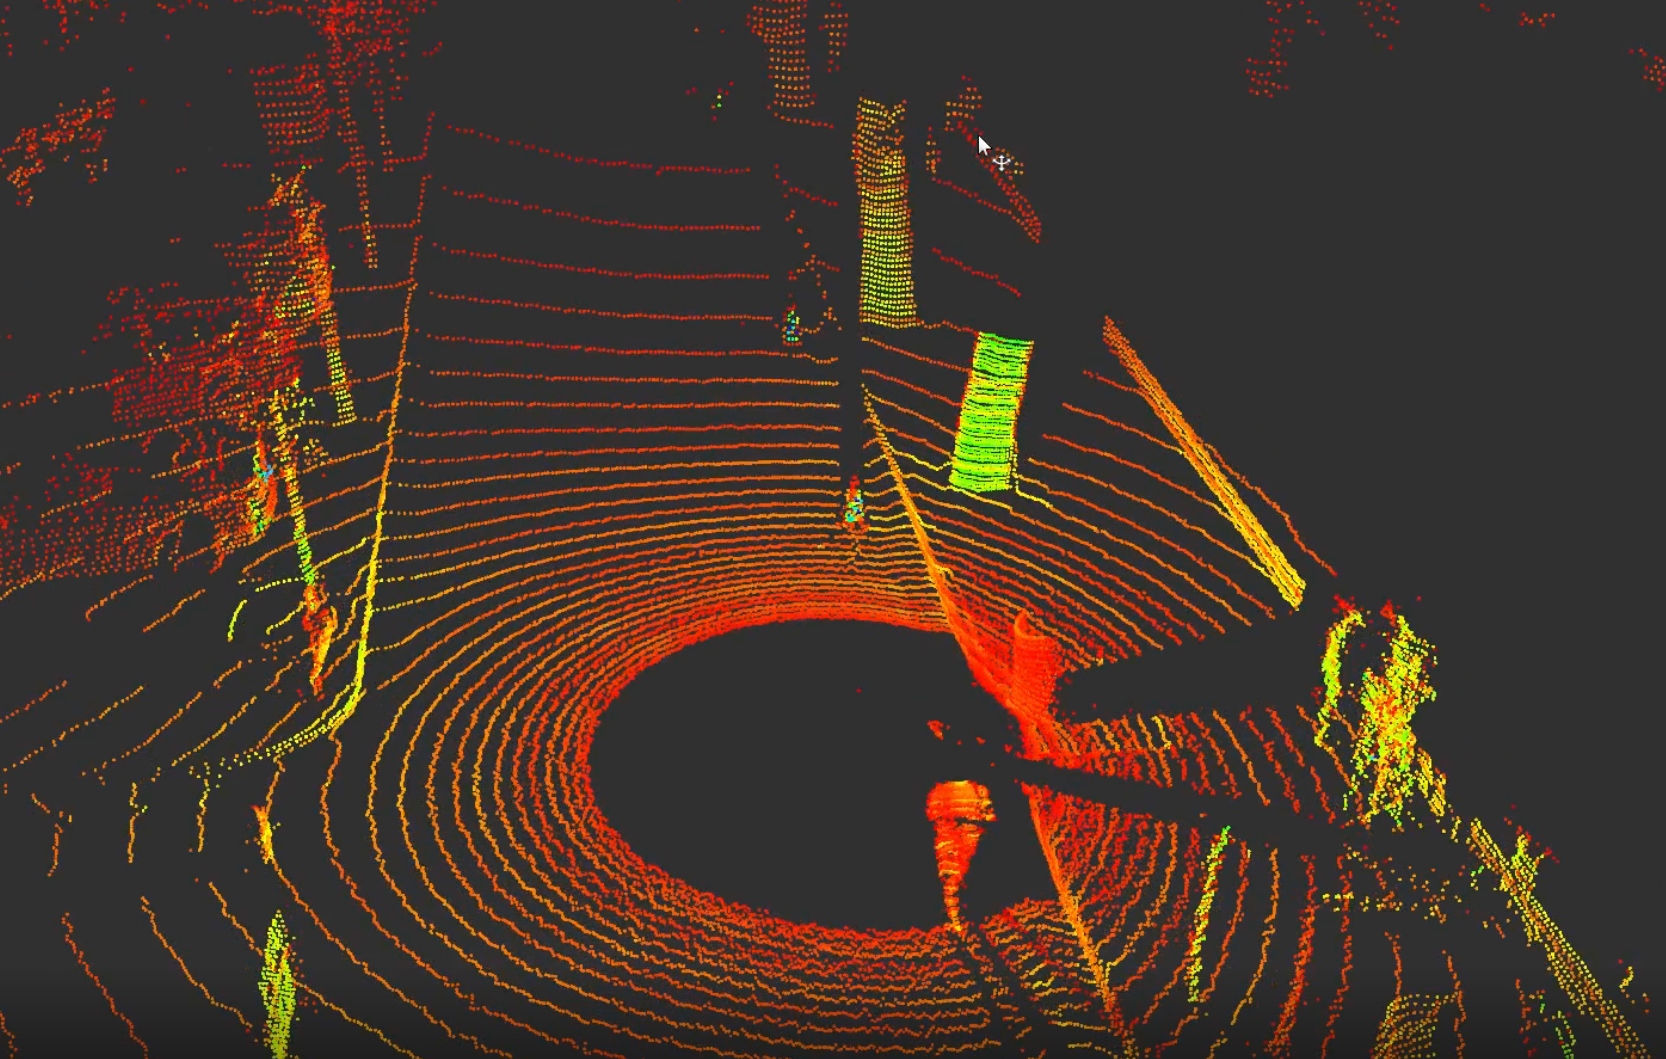
Image 8.4 Detection output by a traditional 64-line lidar
With Livox’s material optimization and high-precision resolution, we can see that Livox Horizon lidars deliver the best display results for road signs and surface markings.
Highways
Based on the above test on reflectivity, the team further applied the optimization methods in a highway scenario to facilitate the creation of a high-precision semantic map. To obtain a high-precision three-dimensional map of an urban area, the team deployed multiple Livox lidars with large FOV to map a large scene.
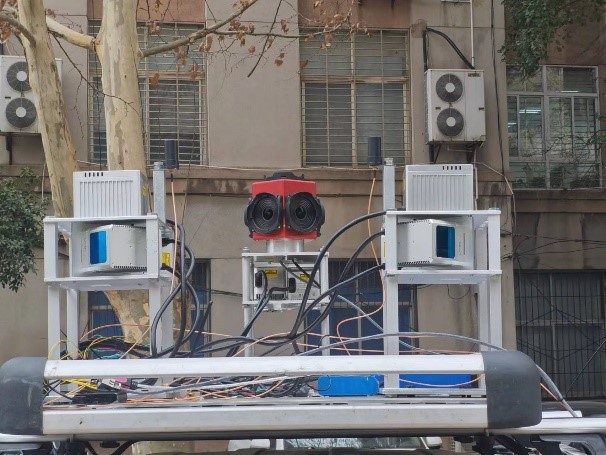
Image 9 Eight-lidar mapping platform (6 Livox Horizon and 2 Livox Tele-15)
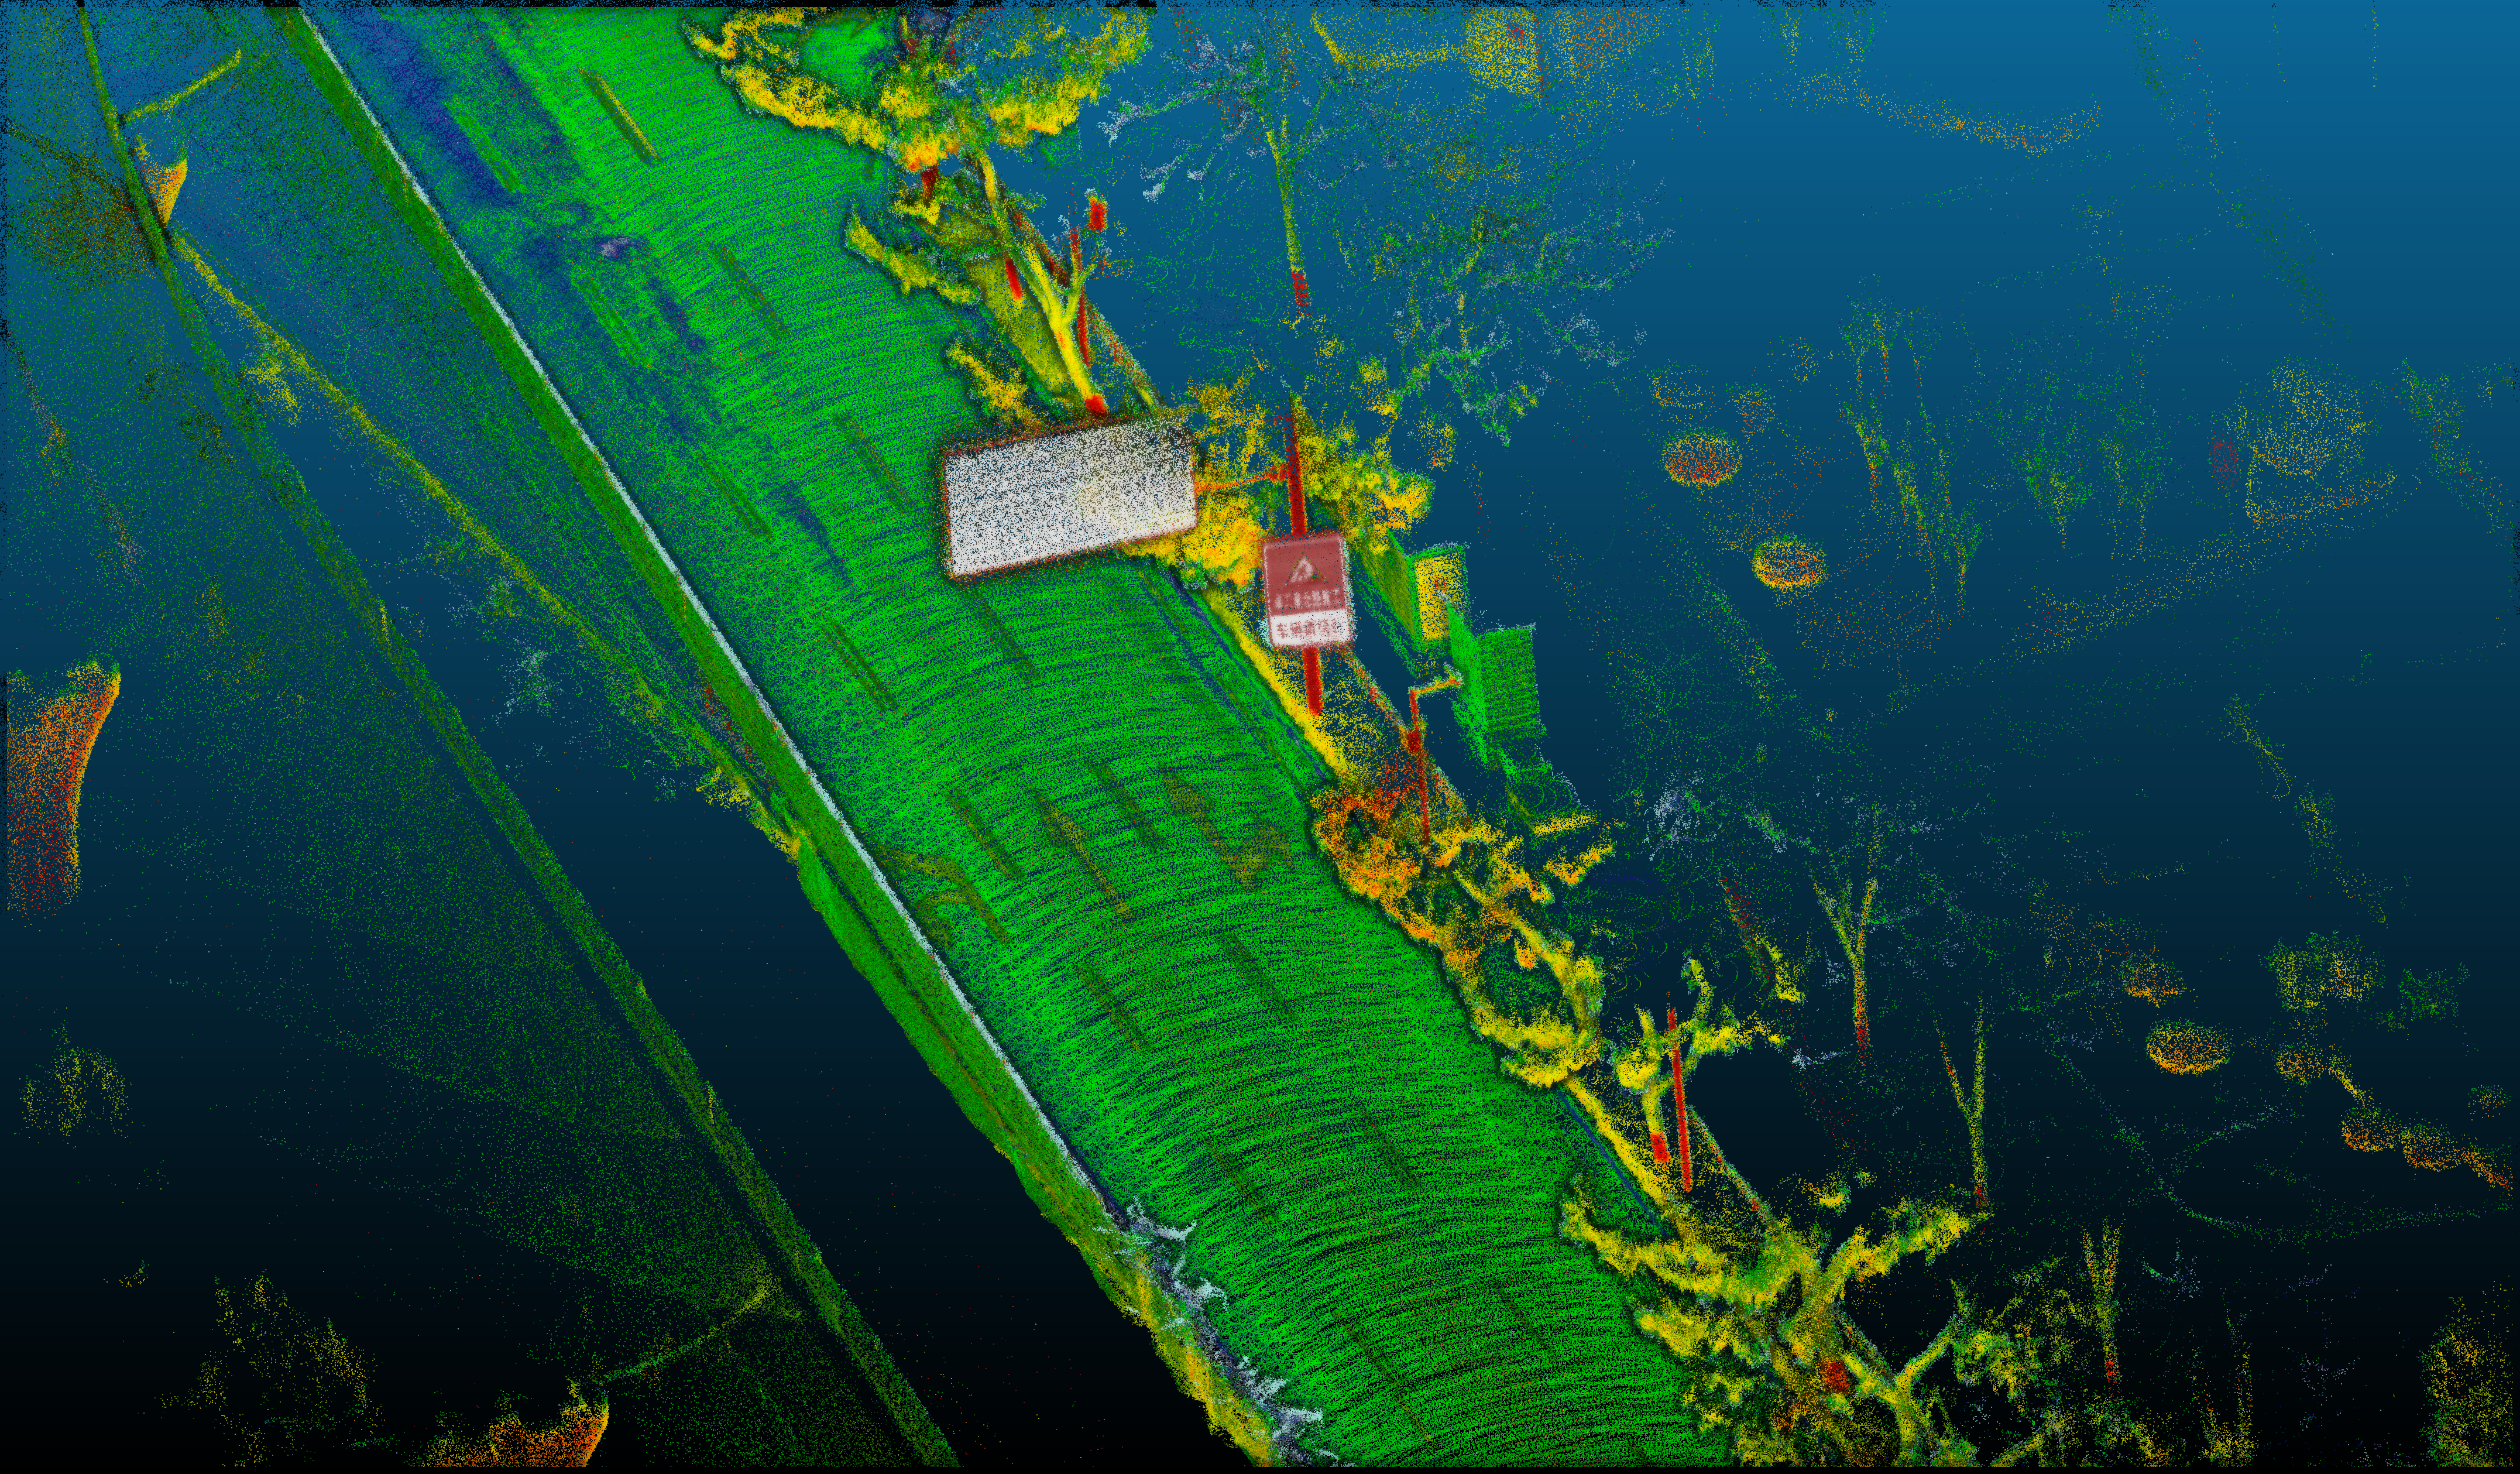
Image 10 Detection result after adjustment
Video 2 Mapping of a large highway scene
After reflectivity optimization, the Chinese characters on the road sign and surface (Image 10) became clear, which is helpful for feature selection by high-resolution map-makers and the work of map annotators.
The multiple tests above demonstrate that the high-precision reflectivity annotation by Livox lidars can yield excellent results for the detection of railway and road features such as road surface markings and railway tracks. The visualization outcome can be further enhanced through specific coloration patterns, to better assist in manual inspection and semantic annotation during high-precision mapping.
VaST Research Team of Wuhan University
The Versatile and Smart Transportation (VaST) group at Wuhan University is a research team led by Professor Lou Yidong and Professor Song Weiwei focused on self-driving applications for rail transportation. The team has achieved notable results in the field of high-precision positioning and environmental monitoring for rail transportation, with some of their research outcomes having been applied on a massive scale in railcars operated by the China Railway Shanghai Group.
Reference [1] Wang, Y., Lou, Y., Song, W., & Tu, Z. (2022). A Tightly-Coupled Framework for Large-Scale Map Construction with Multiple Non-Repetitive Scanning LiDARs. IEEE Sensors Journal.
武汉大学VaST 课题组的王昱升博士最近分享了他们在轨道交通场景下利用Livox 激光雷达进行建图,并基于高精度反射率对点云图进行色彩优化,辅助轨道交通语义地图构建的工作。
实测场景及点云图
项目组计划通过自研SLAM算法针对大场景铁路环境进行地图构建,并结合自动化的电力杆塔、铁轨及轨旁信号机提取方法,达到构建铁路环境语义地图的目的。但在实际实验中,会出现特征未提取或错误提取(如将立式信号机提取为电力杆塔)的情况,需要人工结合点云地图进行手动筛查。由于轨道线路长、点云数据量大等特点,为保证高效准确的人工筛查工作,良好的点云可视化效果必不可少。
为选取能直观展示的可视化测试结果,项目组选取某货运保养工区进行了语义地图构建及人工筛查工作。通过自研的Rail-SLAM算法,结合多个Livox激光雷达对场景进行重建,并自动化生成语义地图。
图1 实测货运铁路保养工区图示
图2 项目组自研七雷达轨道车高精地图采集设备(5个Livox Horizon,2个Livox Tele-15)
图3 通过自研算法生成的语义地图;其中绿色线为铁轨中心线,大绿点为电力杆塔,小点为完成各种任务的轨旁信号机
图4.1 Livox Viewer 默认分辨率输出效果
从上图可看出,得益于Livox 激光雷达的高精度分辨率,利用默认反射率信息输出就已经可以清晰分辨铁轨、枕木等特征物体。
图4.2 细节图(图4.1 左下)
图4.2 可看出常见的水泥材质(如建筑物、电力杆塔等)会呈现出绿色;铁轨、电力线缆等钢制物体会呈现出蓝色。
视频1 Rail-SLAM 轨道建图效果
为解决同类材质物体反射率差异小导致缺乏颜色变化容易造成误识别的问题,项目组进一步结合点云图和编辑软件对可视化效果进行了优化。
优化方法 准备软件:Cloudcompare(windows与ubuntu均可)
首先,在cloudcompare 里导入已建好的地图;接着在可视化界面里选择按反射强度显示,并按high contrast 的规则进行显示。在调整过程中,可以根据显示效果选择是否用shader ;或根据点云密度调整点大小;最后完成优化的点云图保存。
图5 配置界面图示
得益于项目高精度自研算法及Livox 的高密度点云特征,从以下成果图可以看到即使列车以每小时70公里的速度行驶,杆塔上的孔洞、轨旁的信号机及道岔机都能轻易肉眼识别。
图6.1 优化后的点云图
图6.2 白色的电力线、杆塔支柱都可轻易分辨,更加方便了对线缆的提取
图6.3 大门上保护用的尖柱都和锈迹斑斑的大门形成鲜明对比,可以分辨出来
图6.4 铁路检修车轮廓非常清晰,包括半开/全开的玻璃都能肉眼分辨;同时车后用来防止溜车的枕木和金属反射率形成明显对比
为进一步验证这一方法的通用性,作者首先选取了隧道及车道线等多场景使用多款激光雷达基于反射率对比了建图效果;接着选取了公路场景利用上述方法进一步对比图像优化效果。
隧道场景下激光雷达点云对比
在铁路隧道中,轨道车驾驶员是通过悬挂的电力支柱上的编号来完成车辆定位和检修的,所以良好的电力支柱识别和显示对于隧道基准图构建有着重要意义。
在这一测试中,作者选取了如下多款激光雷达对建图效果进行了对比。其中后三种激光雷达采用的是项目组自研Rail-SLAM 算法,所有结果均使用默认反射率输出。
图7.1 价格昂贵的测绘级激光扫描仪配合导航级组合导航设备,后处理建图结果
图7.2 智慧交通常用的高线束半固态激光雷达
图7.3 传统机械式16线激光雷达
图7.4 Livox Horizon 建图效果
从以上建图效果可以看出,基于高精度反射率Livox Horizon 已经可以通过建图结果对特征物体如钢轨、支柱等进行区分了。
车道线检测
作者在丰富的激光雷达应用经验中还发现,市面上较多激光雷达是无法通过默认反射率分辨出车道线的,尤其对浅车道线检测效果更差。以下图不同雷达在rivz 的实时测试效果为例,线束少的16线或32线传统机械式激光雷达,基本上无法分辨车道线和地面标志(道路上的菱形路标)。
图8.1 Livox Horizon 车道线检测效果
图8.2 传统16线车道线检测效果
图8.3 传统40线车道线检测效果
图8.4 传统64线车道线检测效果
而得益于Livox 对路面标志进行的材质优化及高精度分辨率特点,Livox Horizon 激光雷达对于地面标志和车道线的显示效果最好。
公路场景
基于以上的对反射率的验证测试,项目组进一步将该优化方法应用在了公路场景上辅助语义高精度地图的建立上。为高效地获得城市范围的高精度三维地图,作者利用多个Livox 激光雷达提供的大FOV 进行了大场景地图构建。
图9 八雷达地图采集平台(包含6个Livox Horizon 和2个Livox Tele-15)
图10 调整后识别效果
视频2 公路大场景地图构建
可以看到进行反射率优化后的地图上路标上的汉字和路面上的汉字(图10)都非常清晰,方便高精度地图制作人员的特征选取和语义标注人员的语义标注工作。
通过以上多方面测试对比可看出,Livox 激光雷达的高精度反射率标注可以很好的应用在如车道线、铁轨特征物体等的识别上。并可以进一步通过特定赋色规律将这种特性更好的显示出来,从而更好的辅助高精度地图构建流程中的人工检视和语义标注工作。
武汉大学VaST 课题组
武汉大学Versatile and Smart Transportation (VaST)课题组,是由楼益栋教授及宋伟伟教授带领的专注于轨道交通自动驾驶应用的课题组。目前团队在轨道交通高精度定位、环境监测方面取得了丰硕的成果,部分研究已在上海铁路局下辖的轨道作业车上实现批量前装。
参考文献
[1] Wang, Y., Lou, Y., Song, W., & Tu, Z. (2022). A Tightly-Coupled Framework for Large-Scale Map Construction with Multiple Non-Repetitive Scanning LiDARs. IEEE Sensors Journal.
| 


 Posted on 2022-5-26 17:29:57